Key Indicators of Heart Diseases
Heart disease is one of the most prevalent and fatal diseases in the United States. According to CDC, there are 18.2 million cardiovascular patients in the United States, and 659,000 people die from heart disease each year.
Identifying the risk factor for developing heart disease allows clinicians to provide preventive treatment for potential patients. However, heart disease correlates with a number of factors, such as age, smoking, and engagement with physical activities. None of these factors alone seem to be determining and provide a good prediction of future heart failures.
Thus, in this exploratory data analysis, we will leverage visualization techniques to discover the relationship between heart disease and different risk factors, digging out the strongest indicators of cardiac diseases.
Content
This project includes:
- 1. Dataset Description
- 2. Risk Factor: Age
- 3. Risk Factor: Smoking
- 4. Correlation between Sleep and Heart Disease
- 5. Complications of Heart Disease
- 6. Risk Factors: Diabetes & Obesity
- 7. Overview of All Risk Factors
1. Dataset Description
The dataset used in the project comes from the Behavioral Risk Factor Surveillance System of the Centers for Disease Control and Prevention (CDC). CDC collected these data from the United States residents through an annual telephone survey. The dataset used in the project is the CDC’s 2020 survey of 319,795 adults with answers to 18 selected survey questions.
In this project, we will explore the relationships between heart disease, smoking, physical activity engagement, body mass index (BMI), average sleep time, stroke, and diabetes. Here are some short descriptions of these chosen variables:
- Heart Disease: A Binary variable that is Yes if the survey’s respondent have ever reported having coronary heart disease or myocardial infarction and No otherwise.
- Smoking: A Binary variable that is Yes if the respondent has smoked at least 100 cigarettes in their entire life and No otherwise.
- Physical Activity Engagement: A Binary variable that is Yes if the respondent did physical activity or exercise during the past 30 days other than their regular job and No otherwise.
- Body Mass Index (BMI): A Continuous variable which can be computed as the body mass (in kilograms) divided by the square of the body height (in meters). The unit of BMI is kilograms / \(\text{meters}^2\),
- Average Sleep Time: An Integer variable that represents the average hours of sleep of the respondent in 24-hour.
- Stroke: A Binary variable that is Yes if the respondent have ever reported having a stroke and No otherwise.
- Diabetes: A Categorical variable that represents if the respondent has ever had the diabetes in their life. The variable has four categories: “No” (Never have diabetes), “No, borderline” (Do not have diabetes but have risk of developing it), “Yes” (Have or ever had diabetes), and “Yes, during pregnancy” (have/had diabetes during the pregnancy).
- General Health Condition: A Categorical variable. It is what the respondent would say about their health condition in general. The variable has five categories: “Excellent”, “Very Good”, “Good”, “Fair”, and “Poor”.
2. Heart Disease and Age
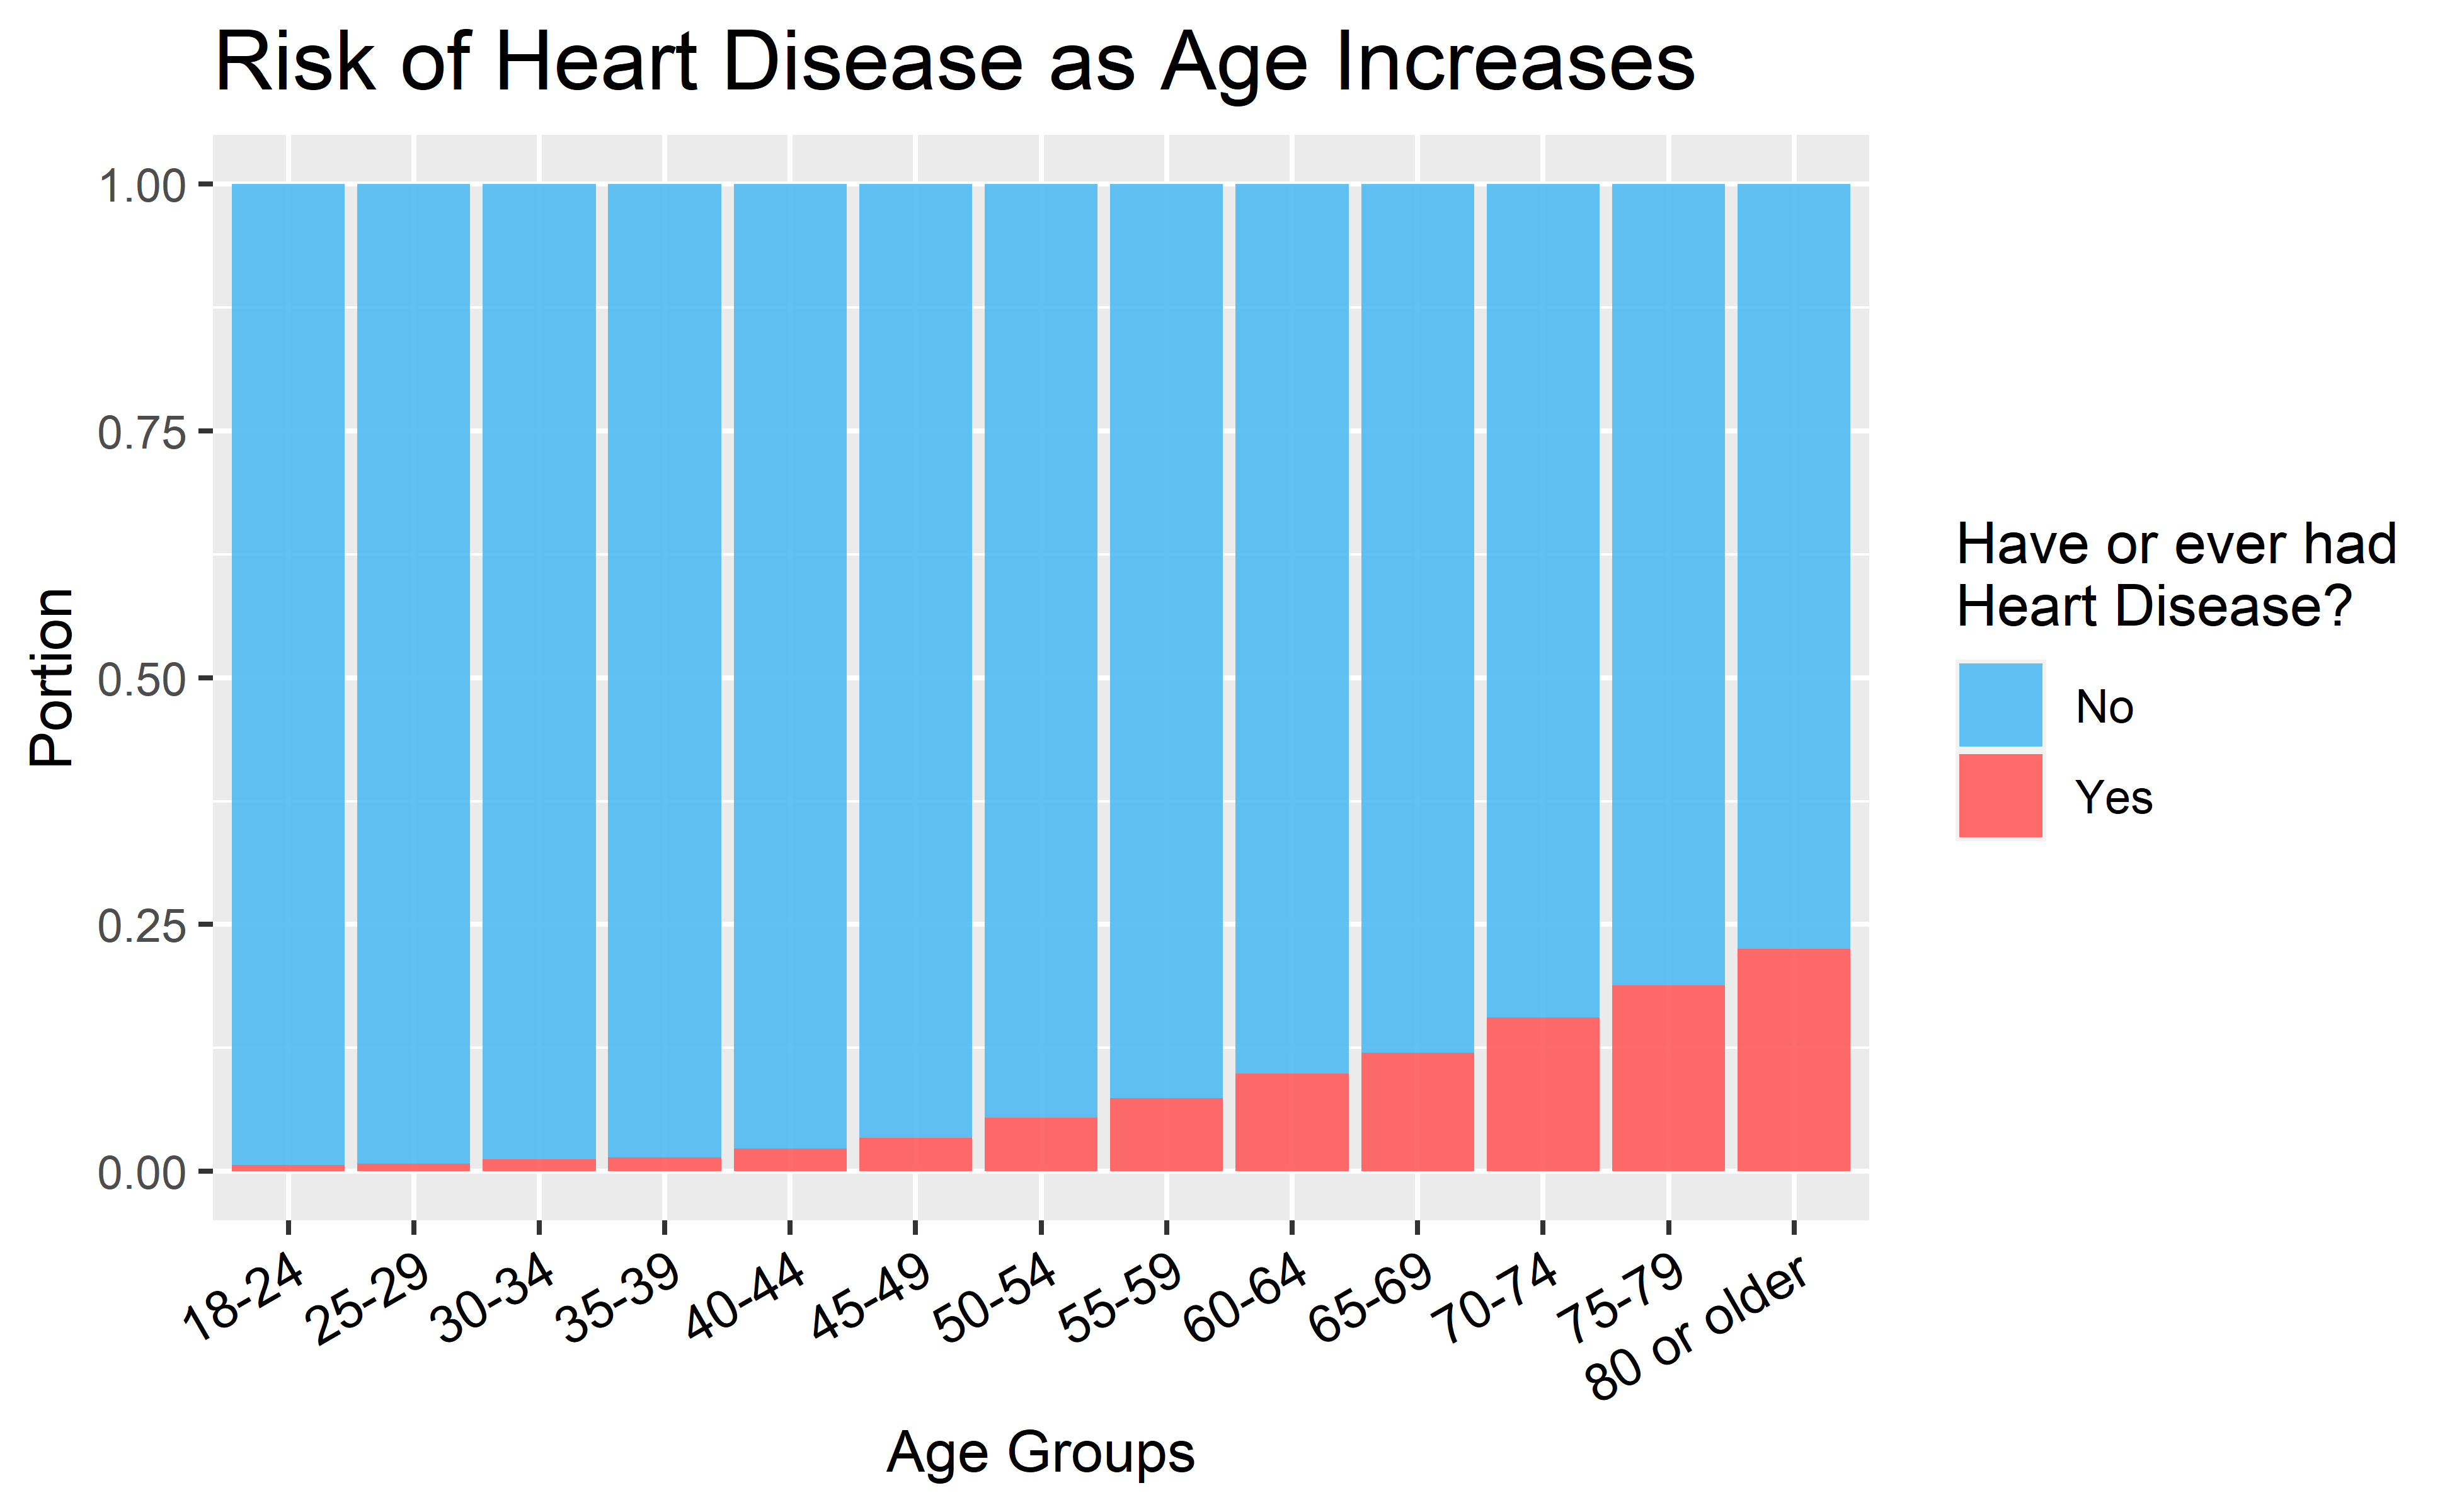
Age is a common risk factor for cardiac and vascular diseases. As we become older, our metabolism and circulation system also degenerates. The elder citizens are thus more likely to develop coronary heart disease or myocardial infarction than their younger counterparts. As shown in the bar chart above, the portion of respondents who have or ever had heart disease increases with the age. For the respondents who are 80 or older, more than 20% of them reported having heart disease.
3. Heart Disease and Smoking
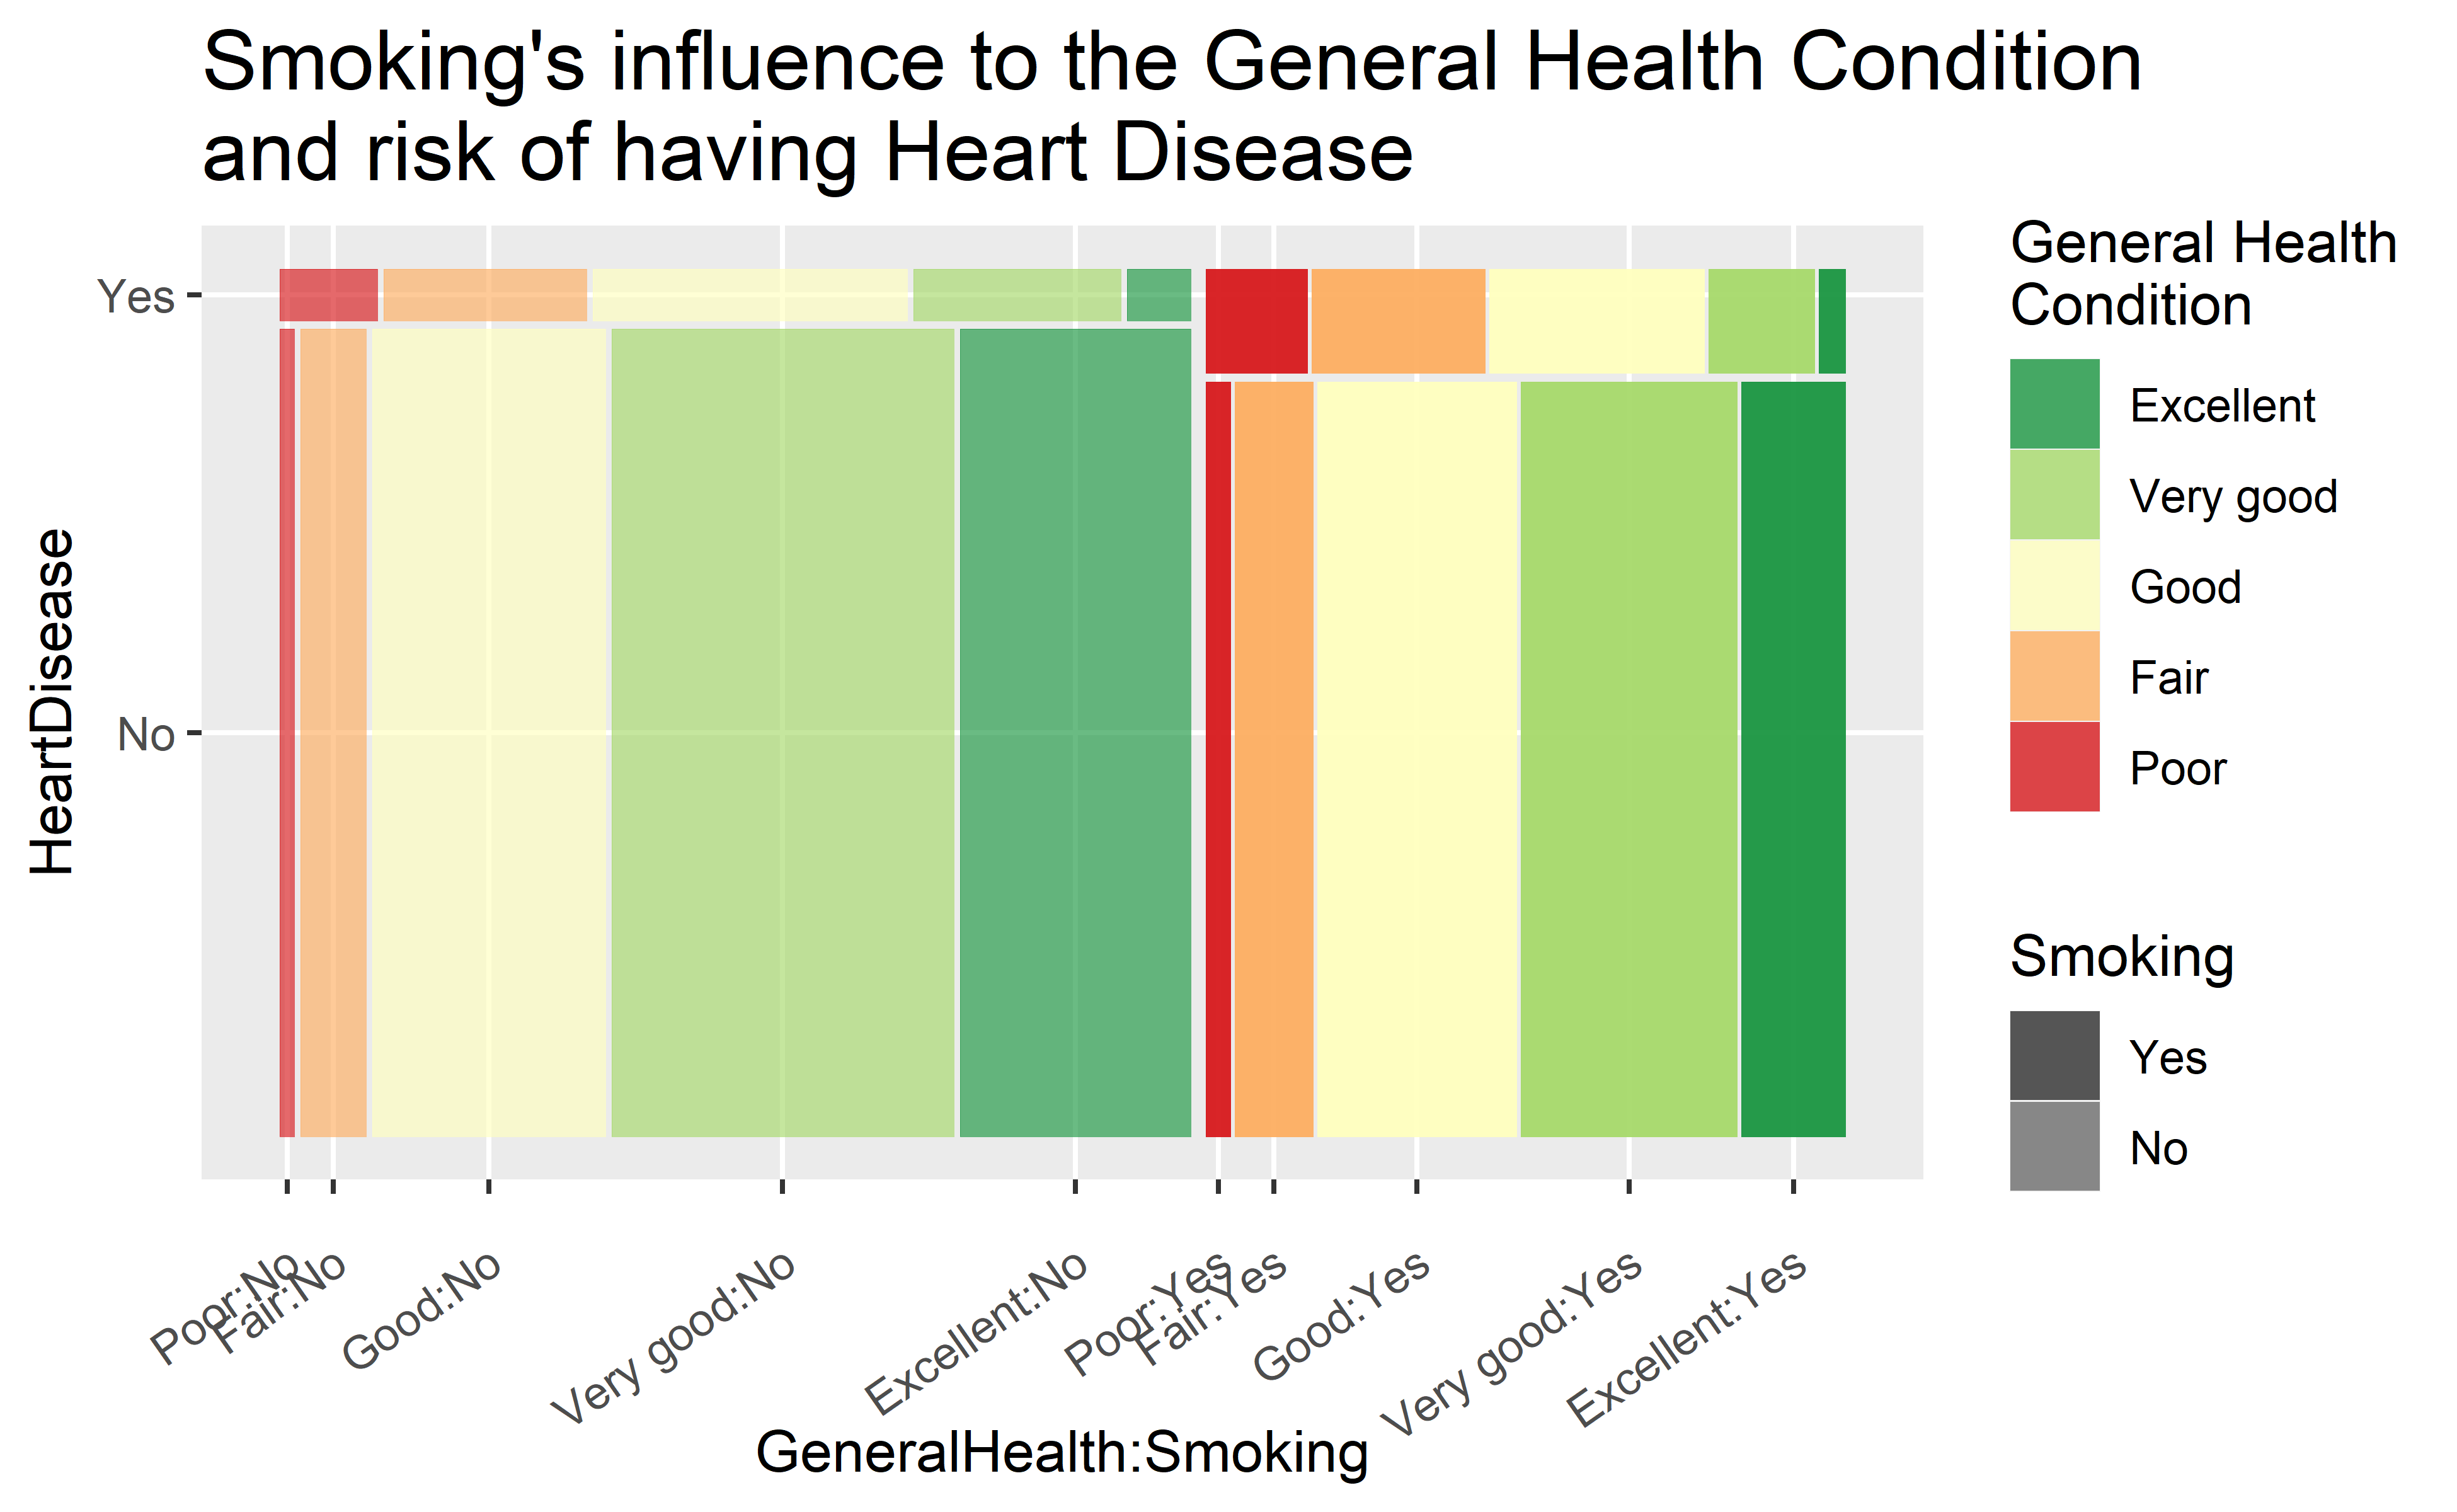
In addition to age, another common risk factor for cancer, cardiac, and pulmonary diseases is smoking. In the survey, CDC asks if a respondent has ever smoked more than 100 cigarettes in their entire life. If the answer is yes, CDC records the variable Smoking as Yes for that (respondent) observation.
As shown in the mosaic plot, the portion of respondents with heart disease is almost double when the respondents smoke, indicating that smoking is a major risk factor. The respondents who smoked and have heart disease are also more likely to have poor or fair general health conditions.
3.1 Alluvial Plot: relationships among heart disease, age, and smoking
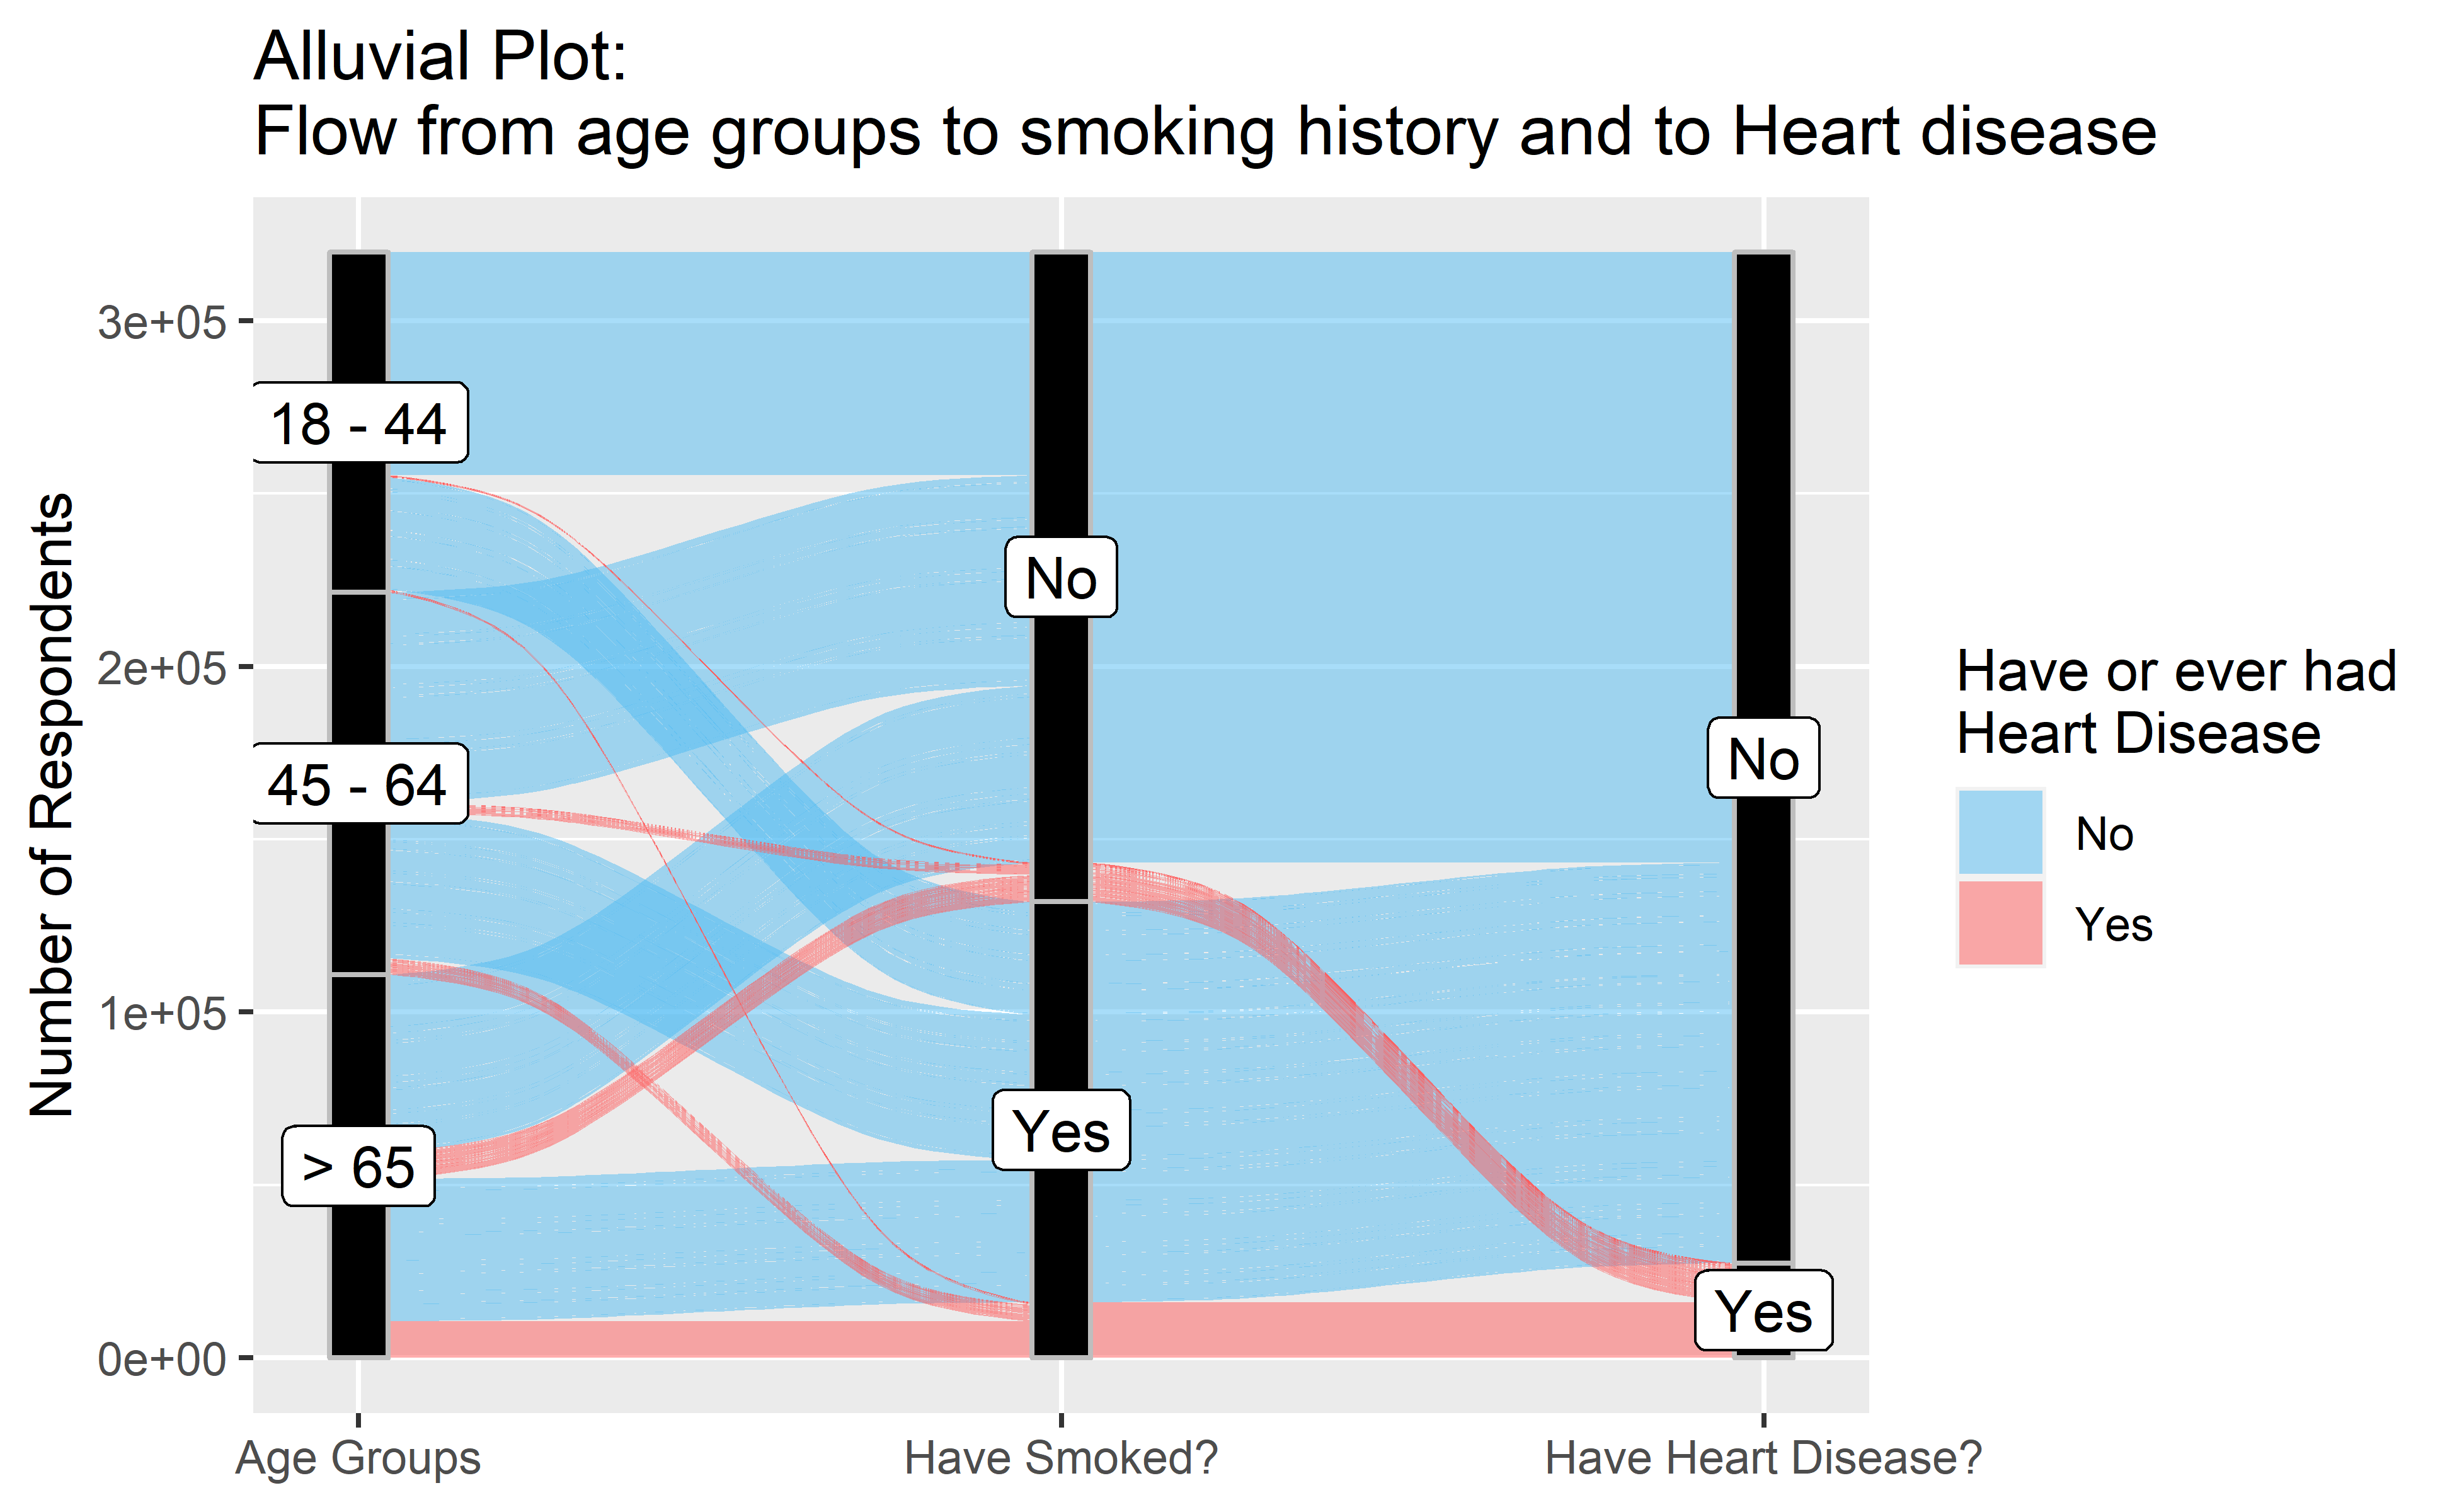
From the previous two sections, we have seen that the Age and Smoking are two strong indicators of heart disease. This Alluvial plot flowing from three age groups and smoking history to the heart disease conditions will help us confirm these findings.
To create this Alluvial plot, I group the respondents with ages 18 - 44, 45 - 64, and 65 or older into three groups, each having roughly an equal number of respondents. Most of the red flow (respondents who have or ever had heart disease) comes from the age group: > 65 and then flows to the smoking: Yes category. This is consistent with our previous observations.
4. Heart Disease and Sleep Time
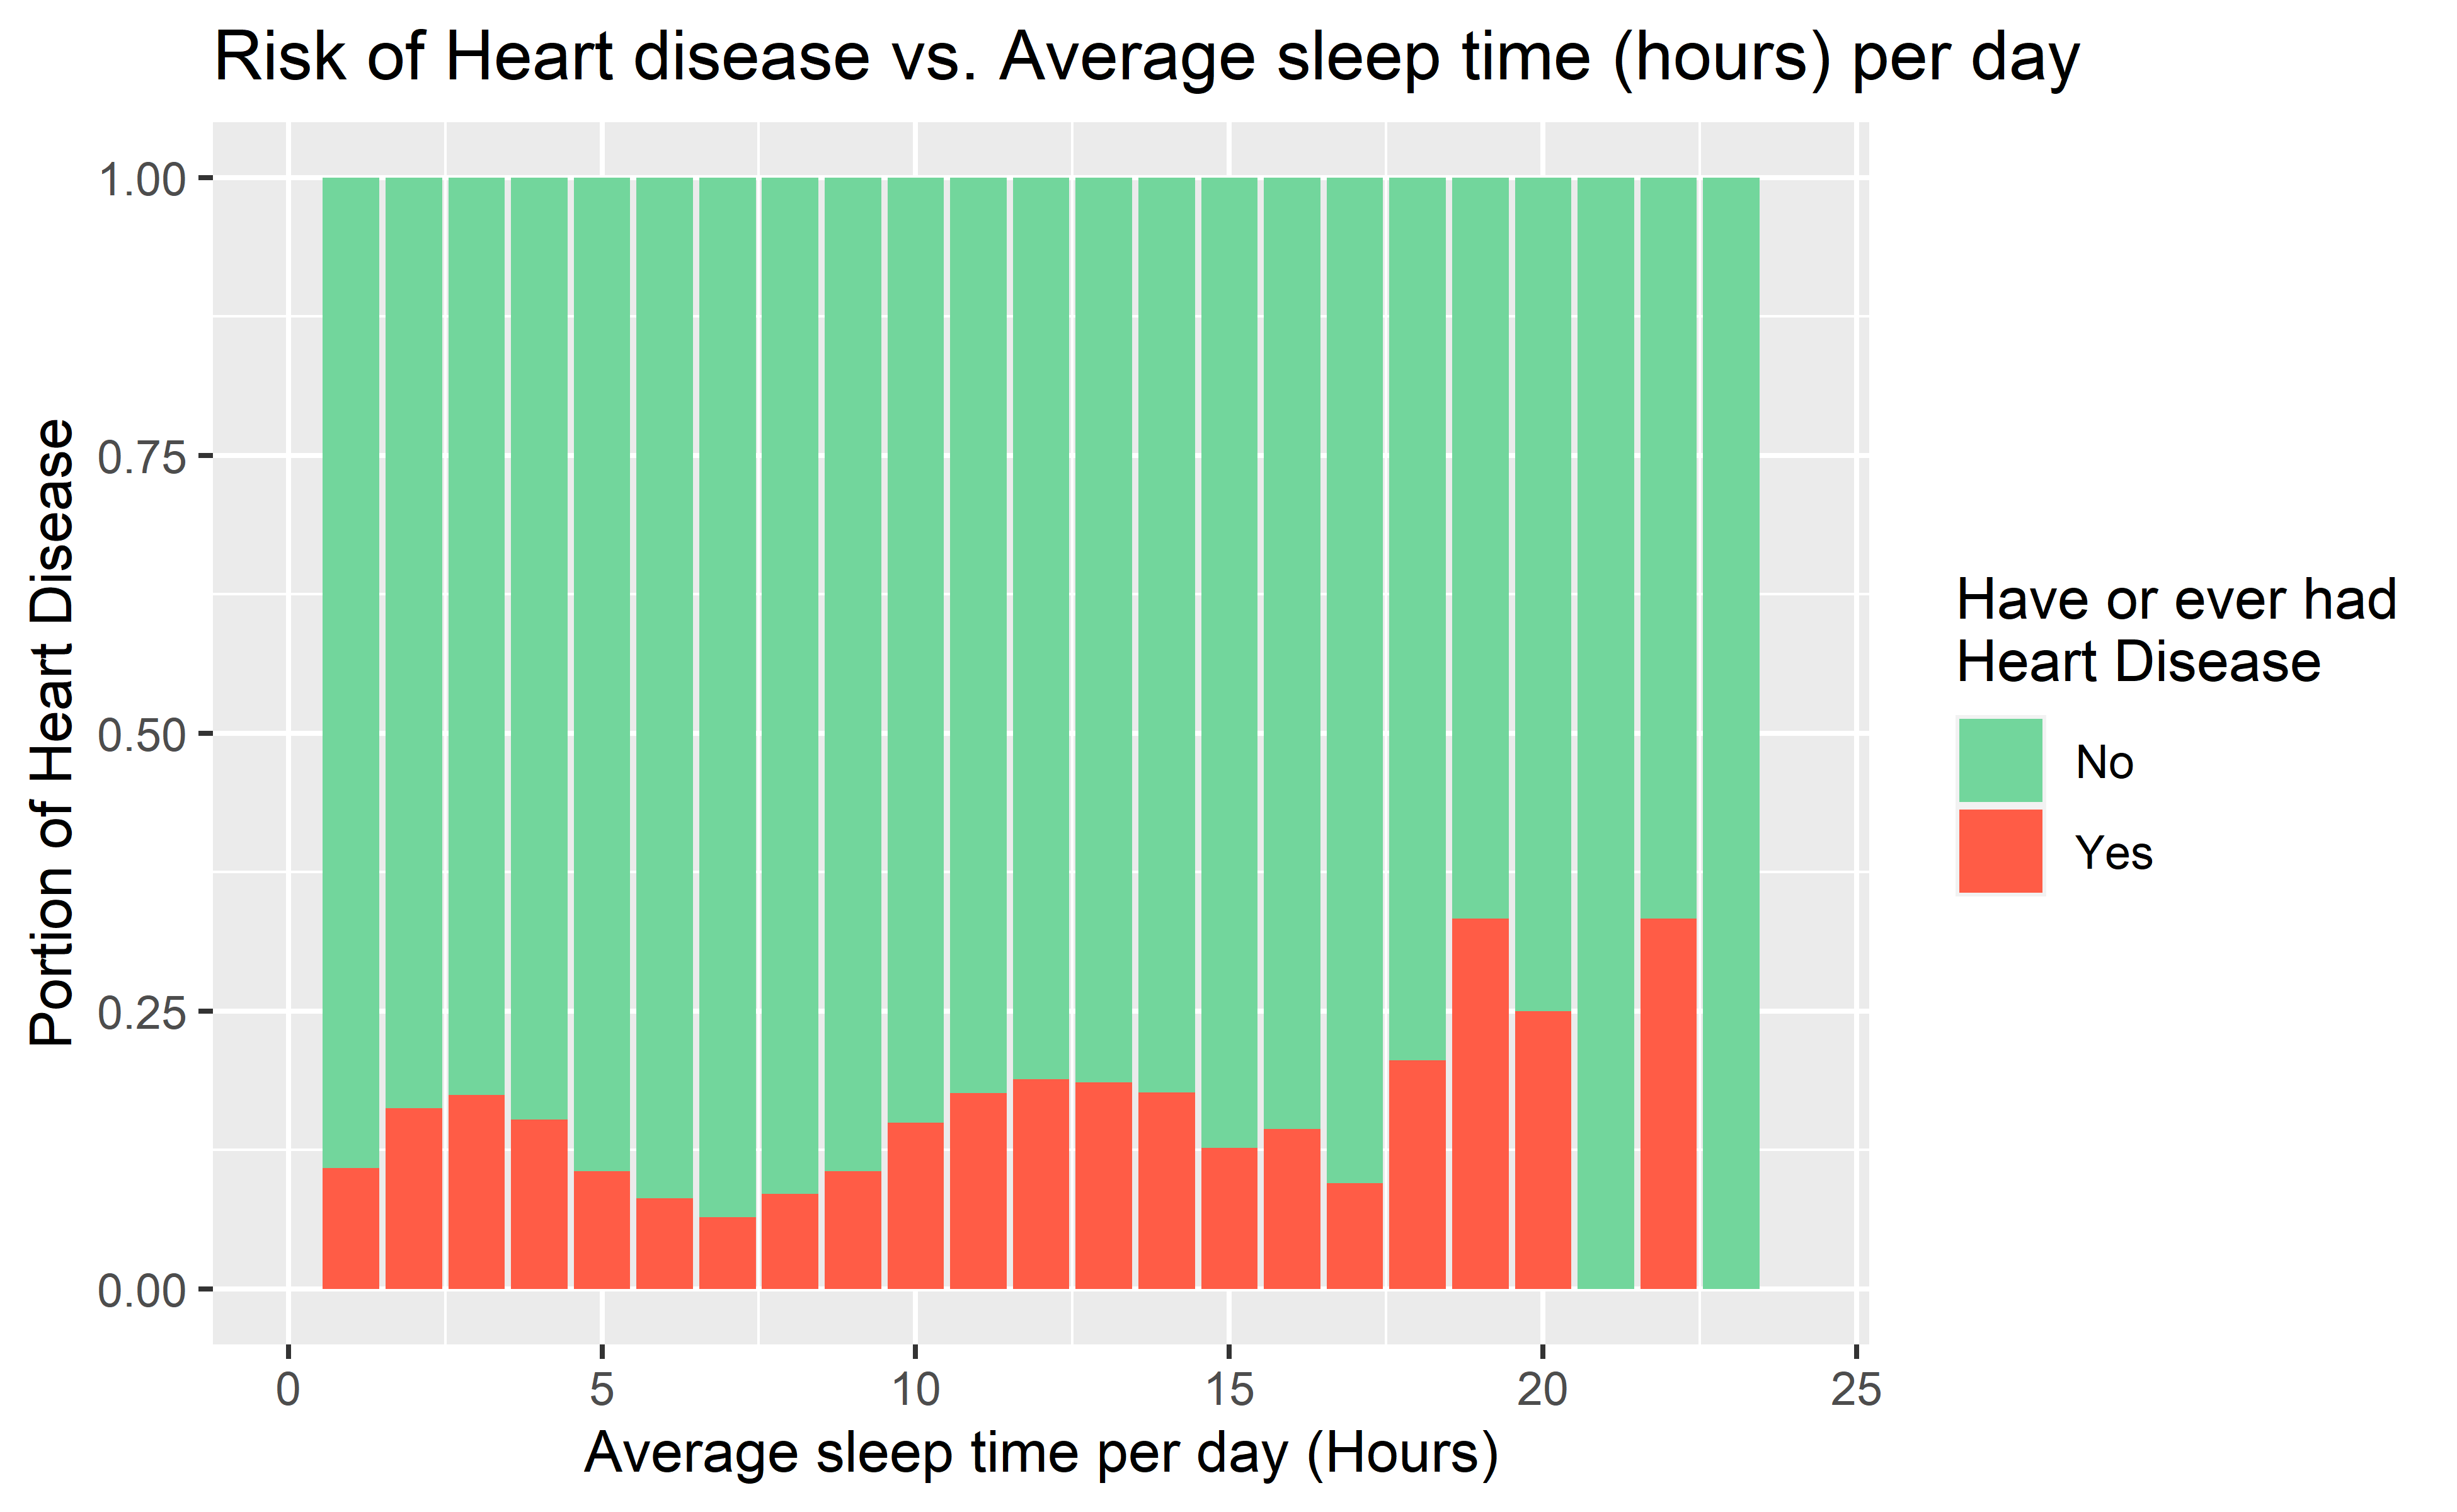
How many hours of sleep does a respondent have when they have or never had heart disease? From the bar chart above, we can find that people who sleep 3 hours (too short), 12 hours, and > 19 hours (too long) are most likely to have heart disease. Most of the healthy respondents sleep around 7 hours per day.
5. Common Complication of Heart Disease
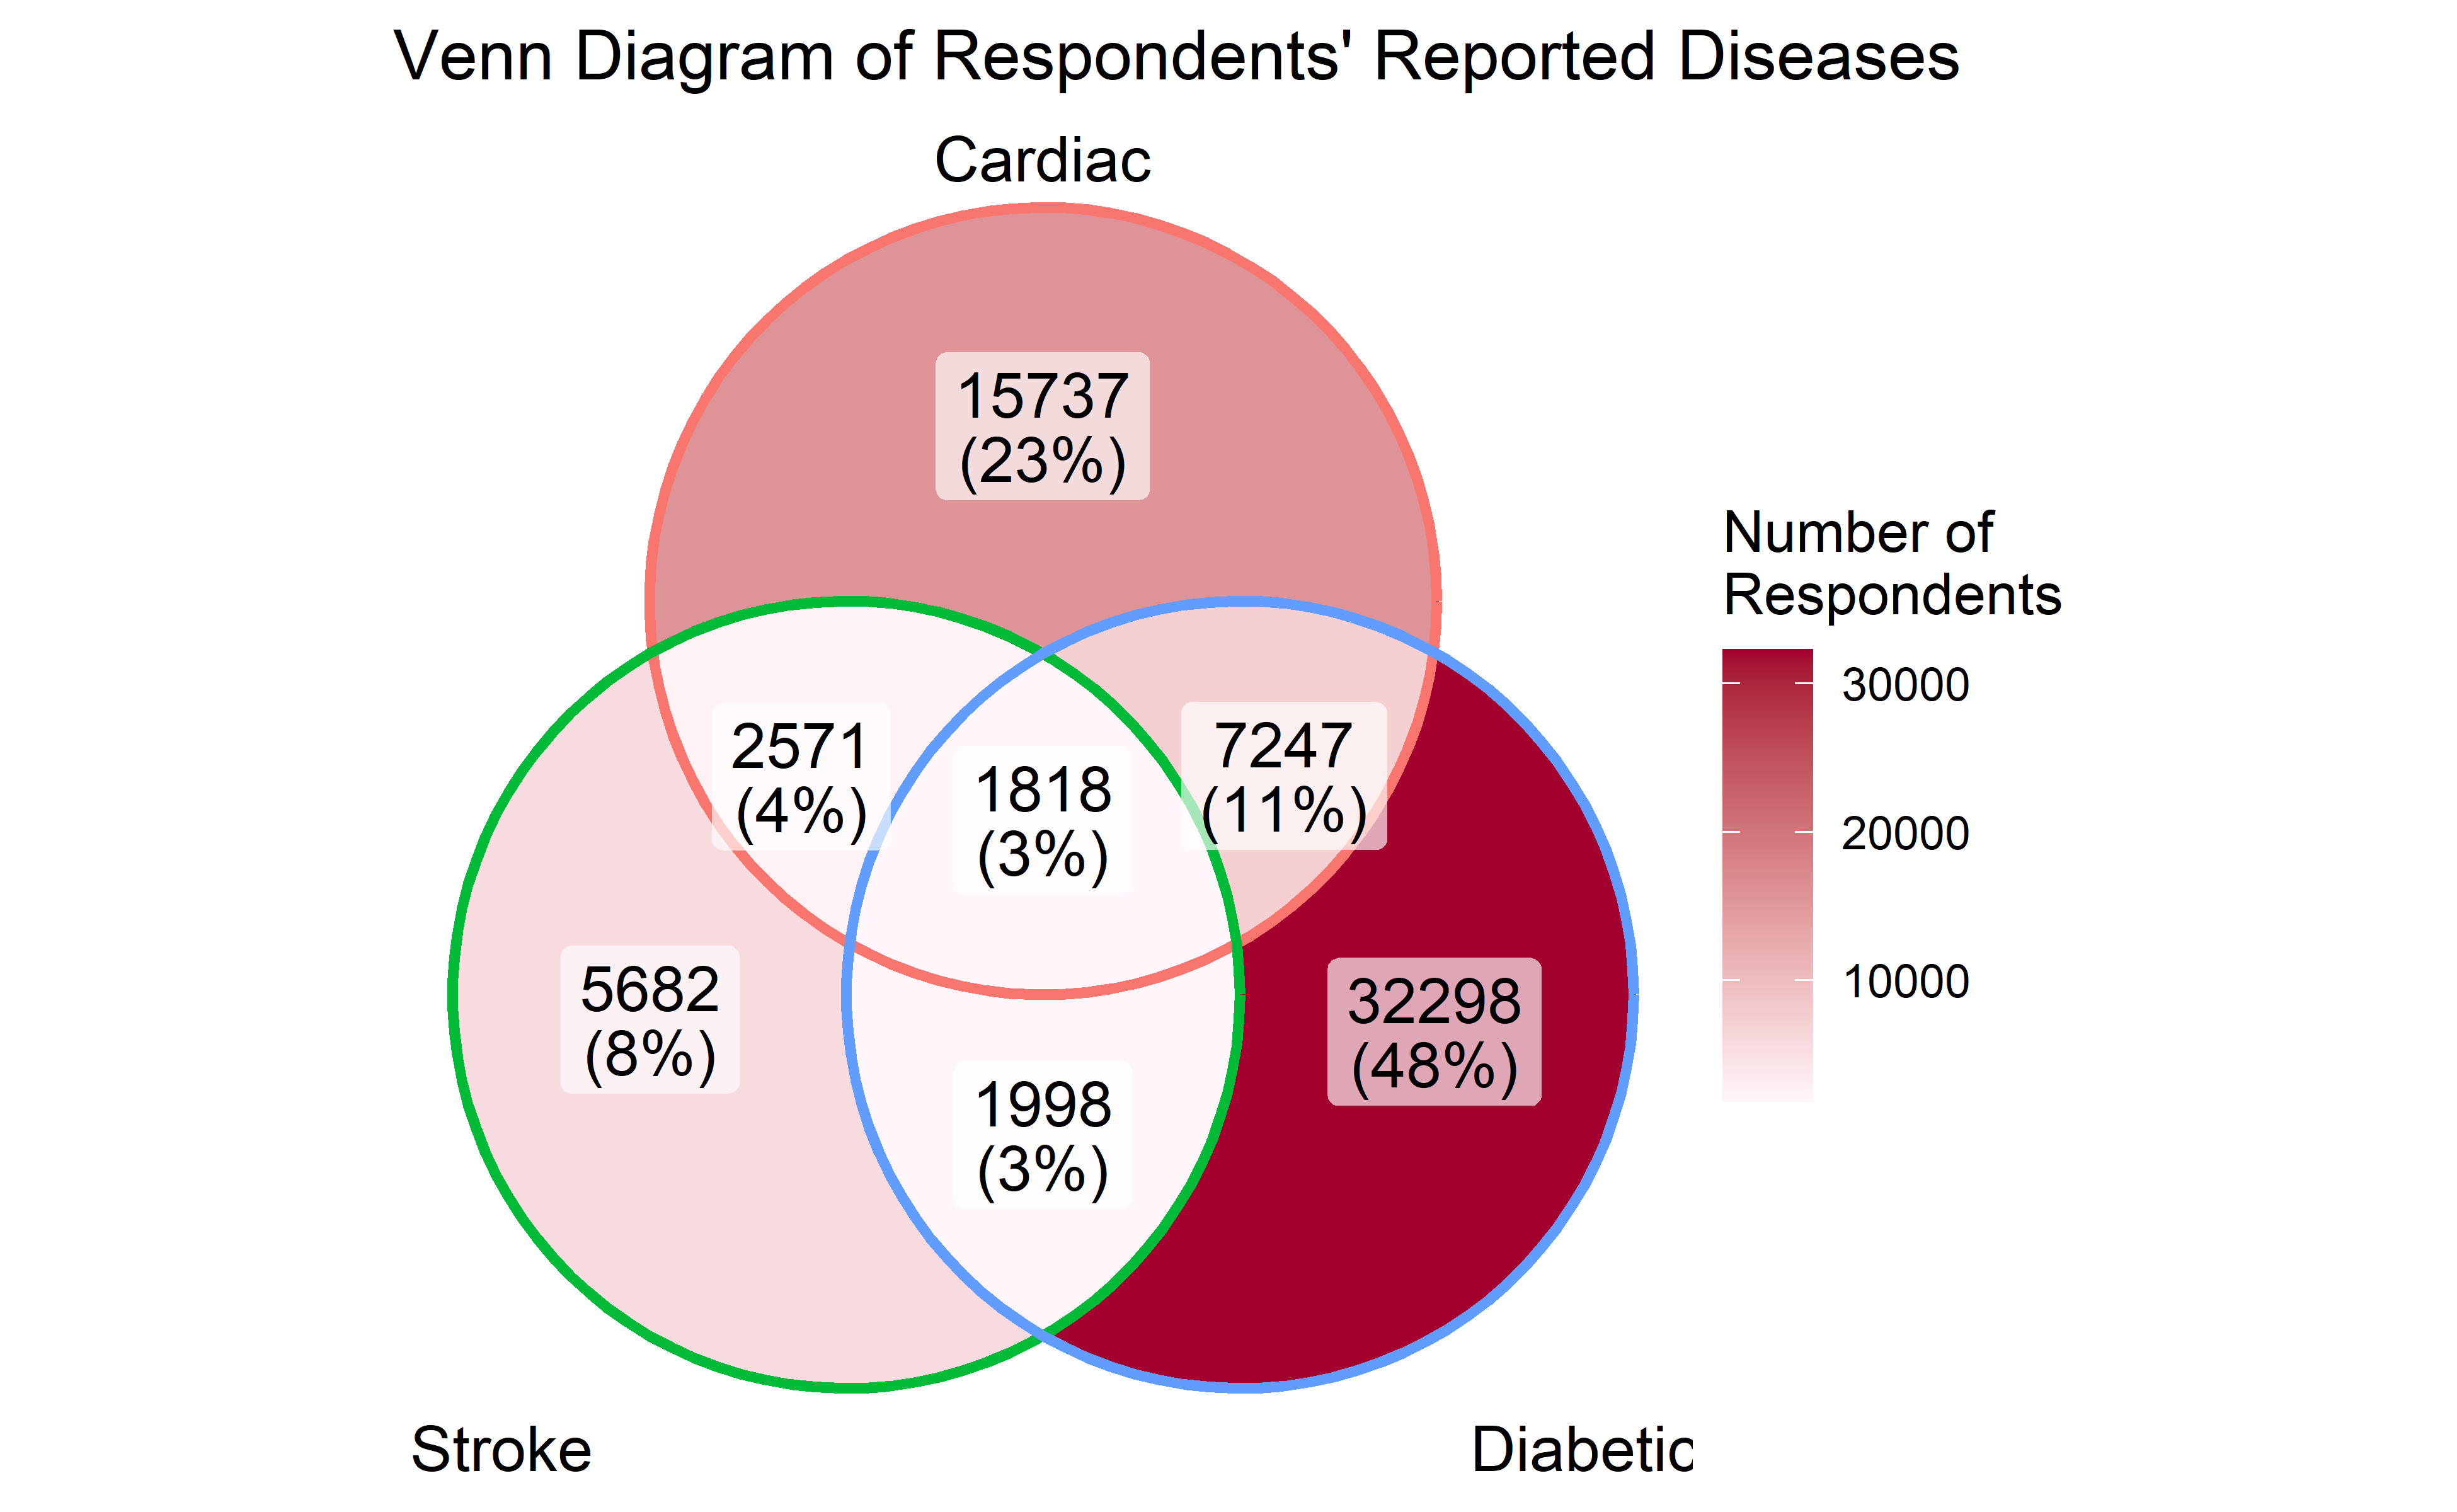
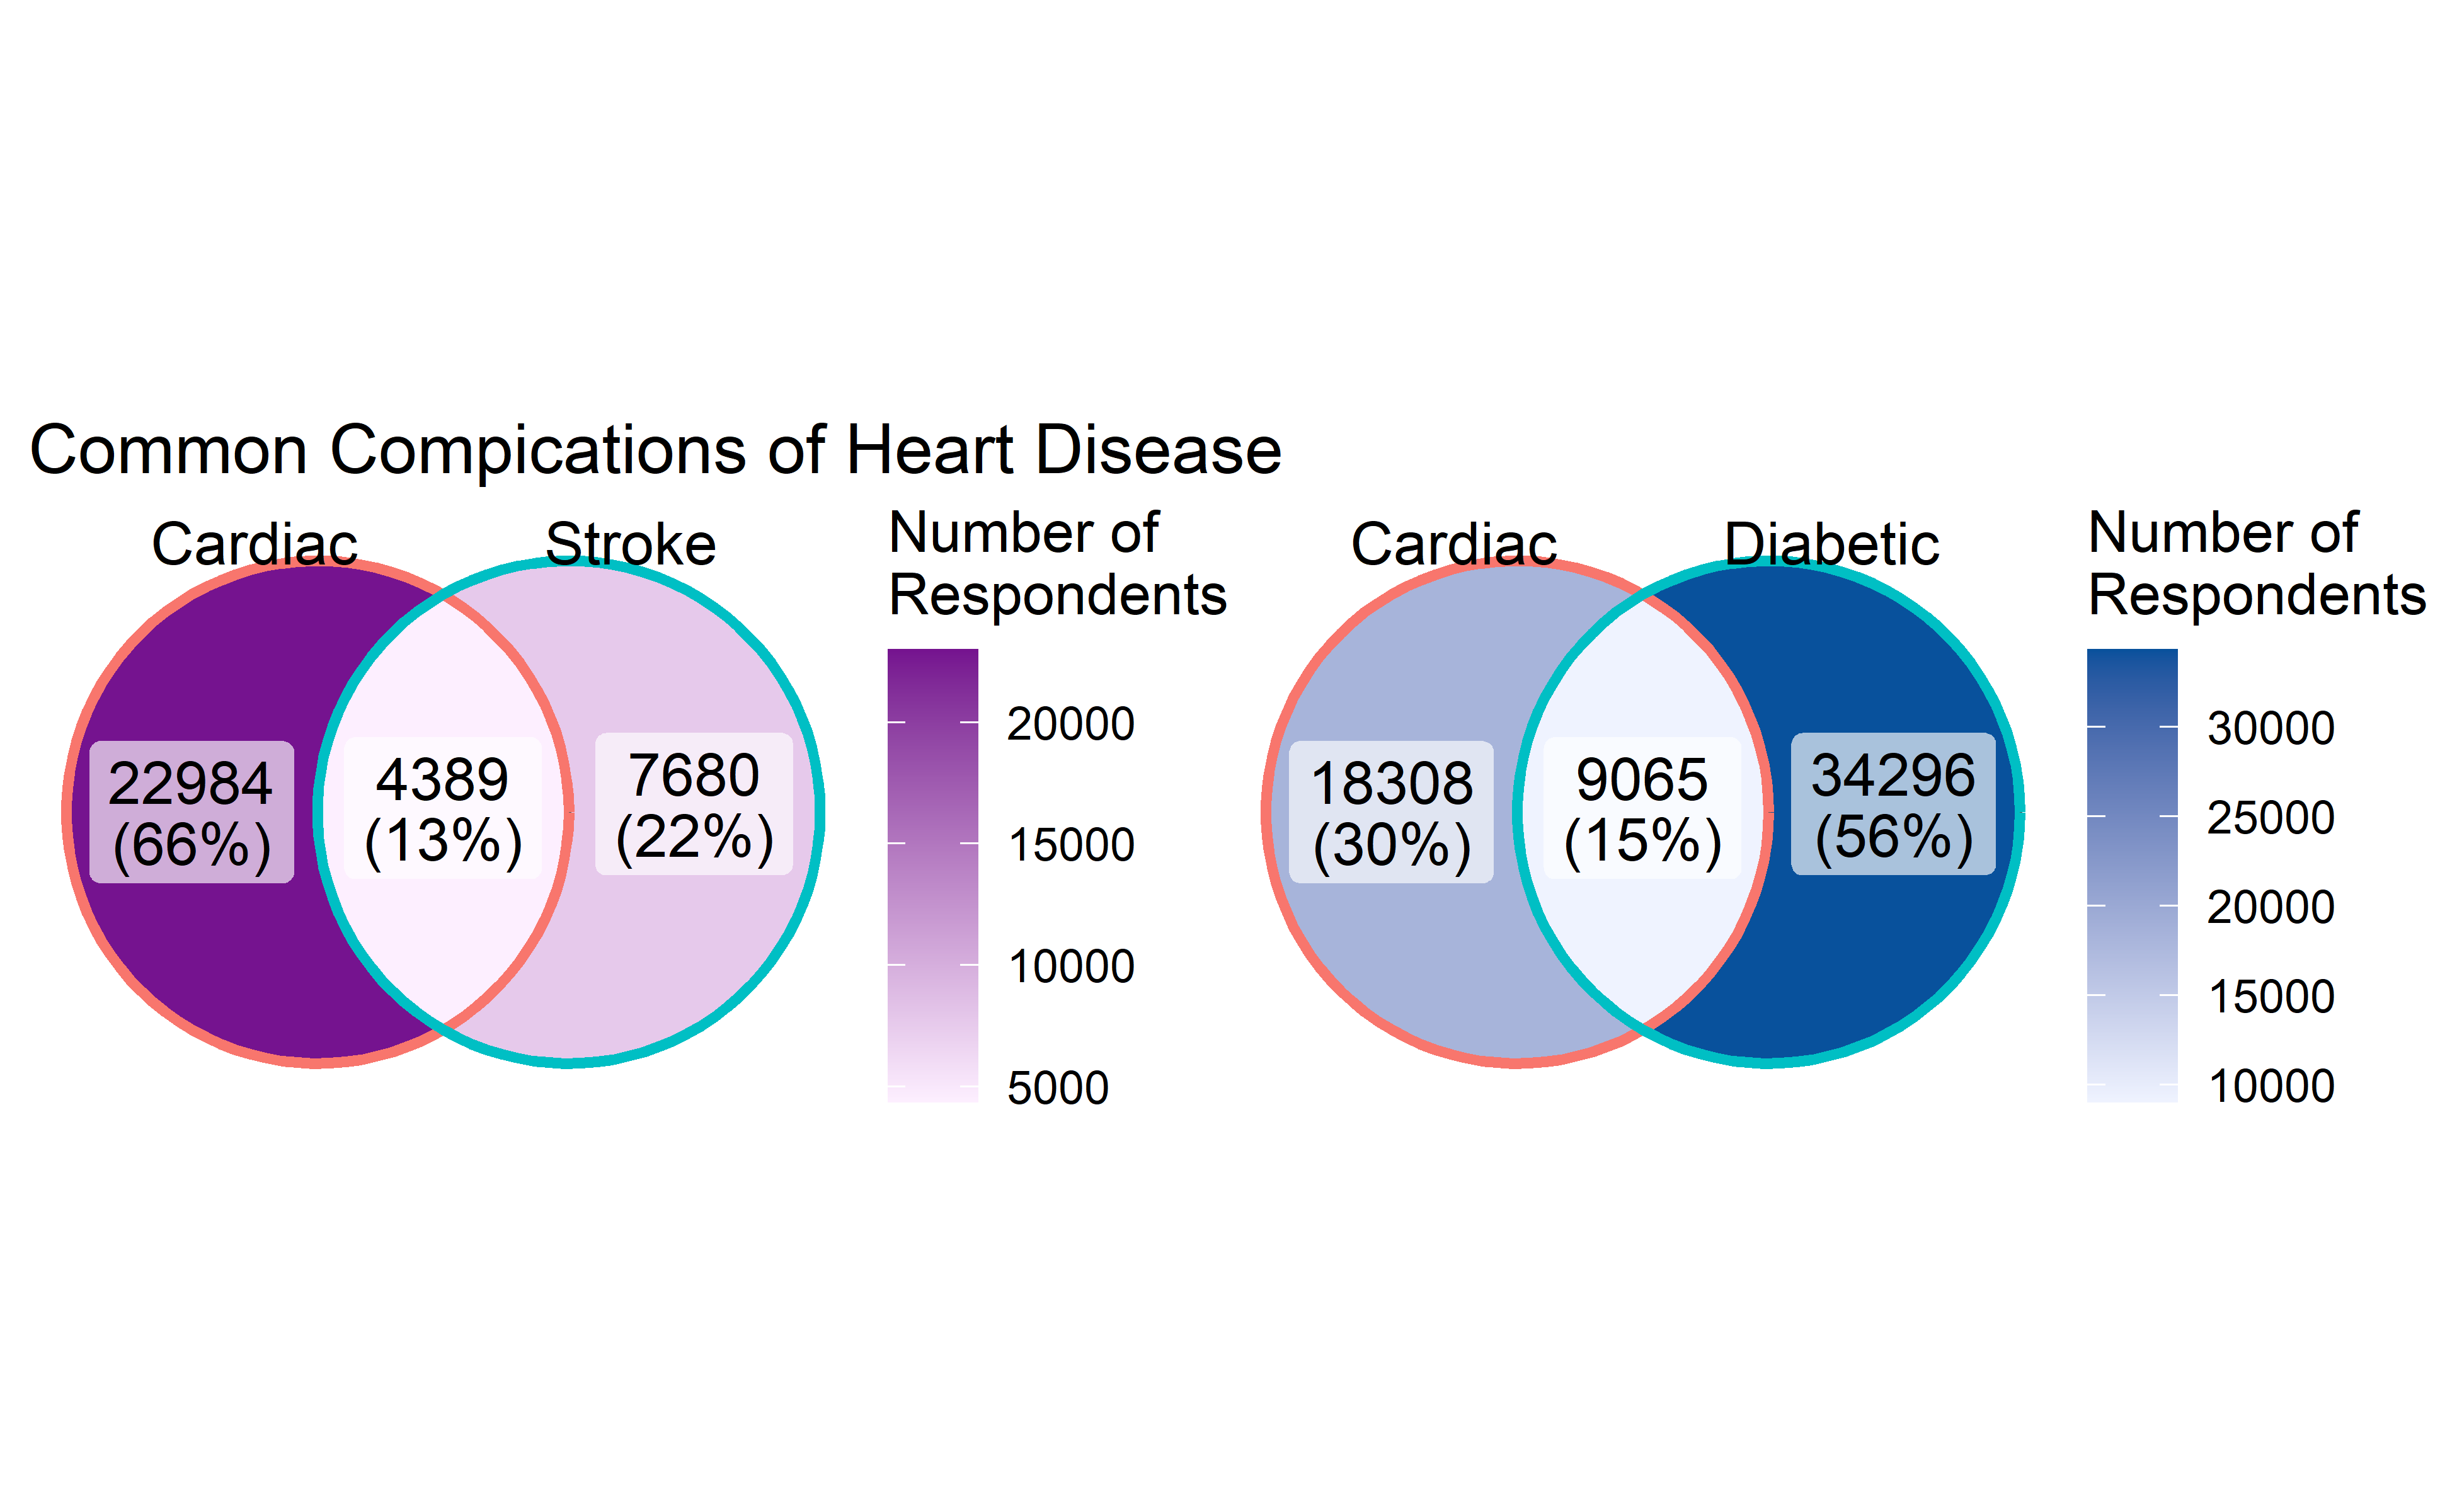
What are the common complications of heart disease? We know that vascular disease, such as stroke, usually comes with a deteriorated circulation system. As shown in the Venn Diagram, about 37.1% of respondents who have a stroke also reported having heart disease. Surprisingly, diabetes also seems to be correlated with heart disease. 33.3% of respondents who have ever reported having heart disease also have diabetes.
6. Heart Disease, Diabetes, and Obesity
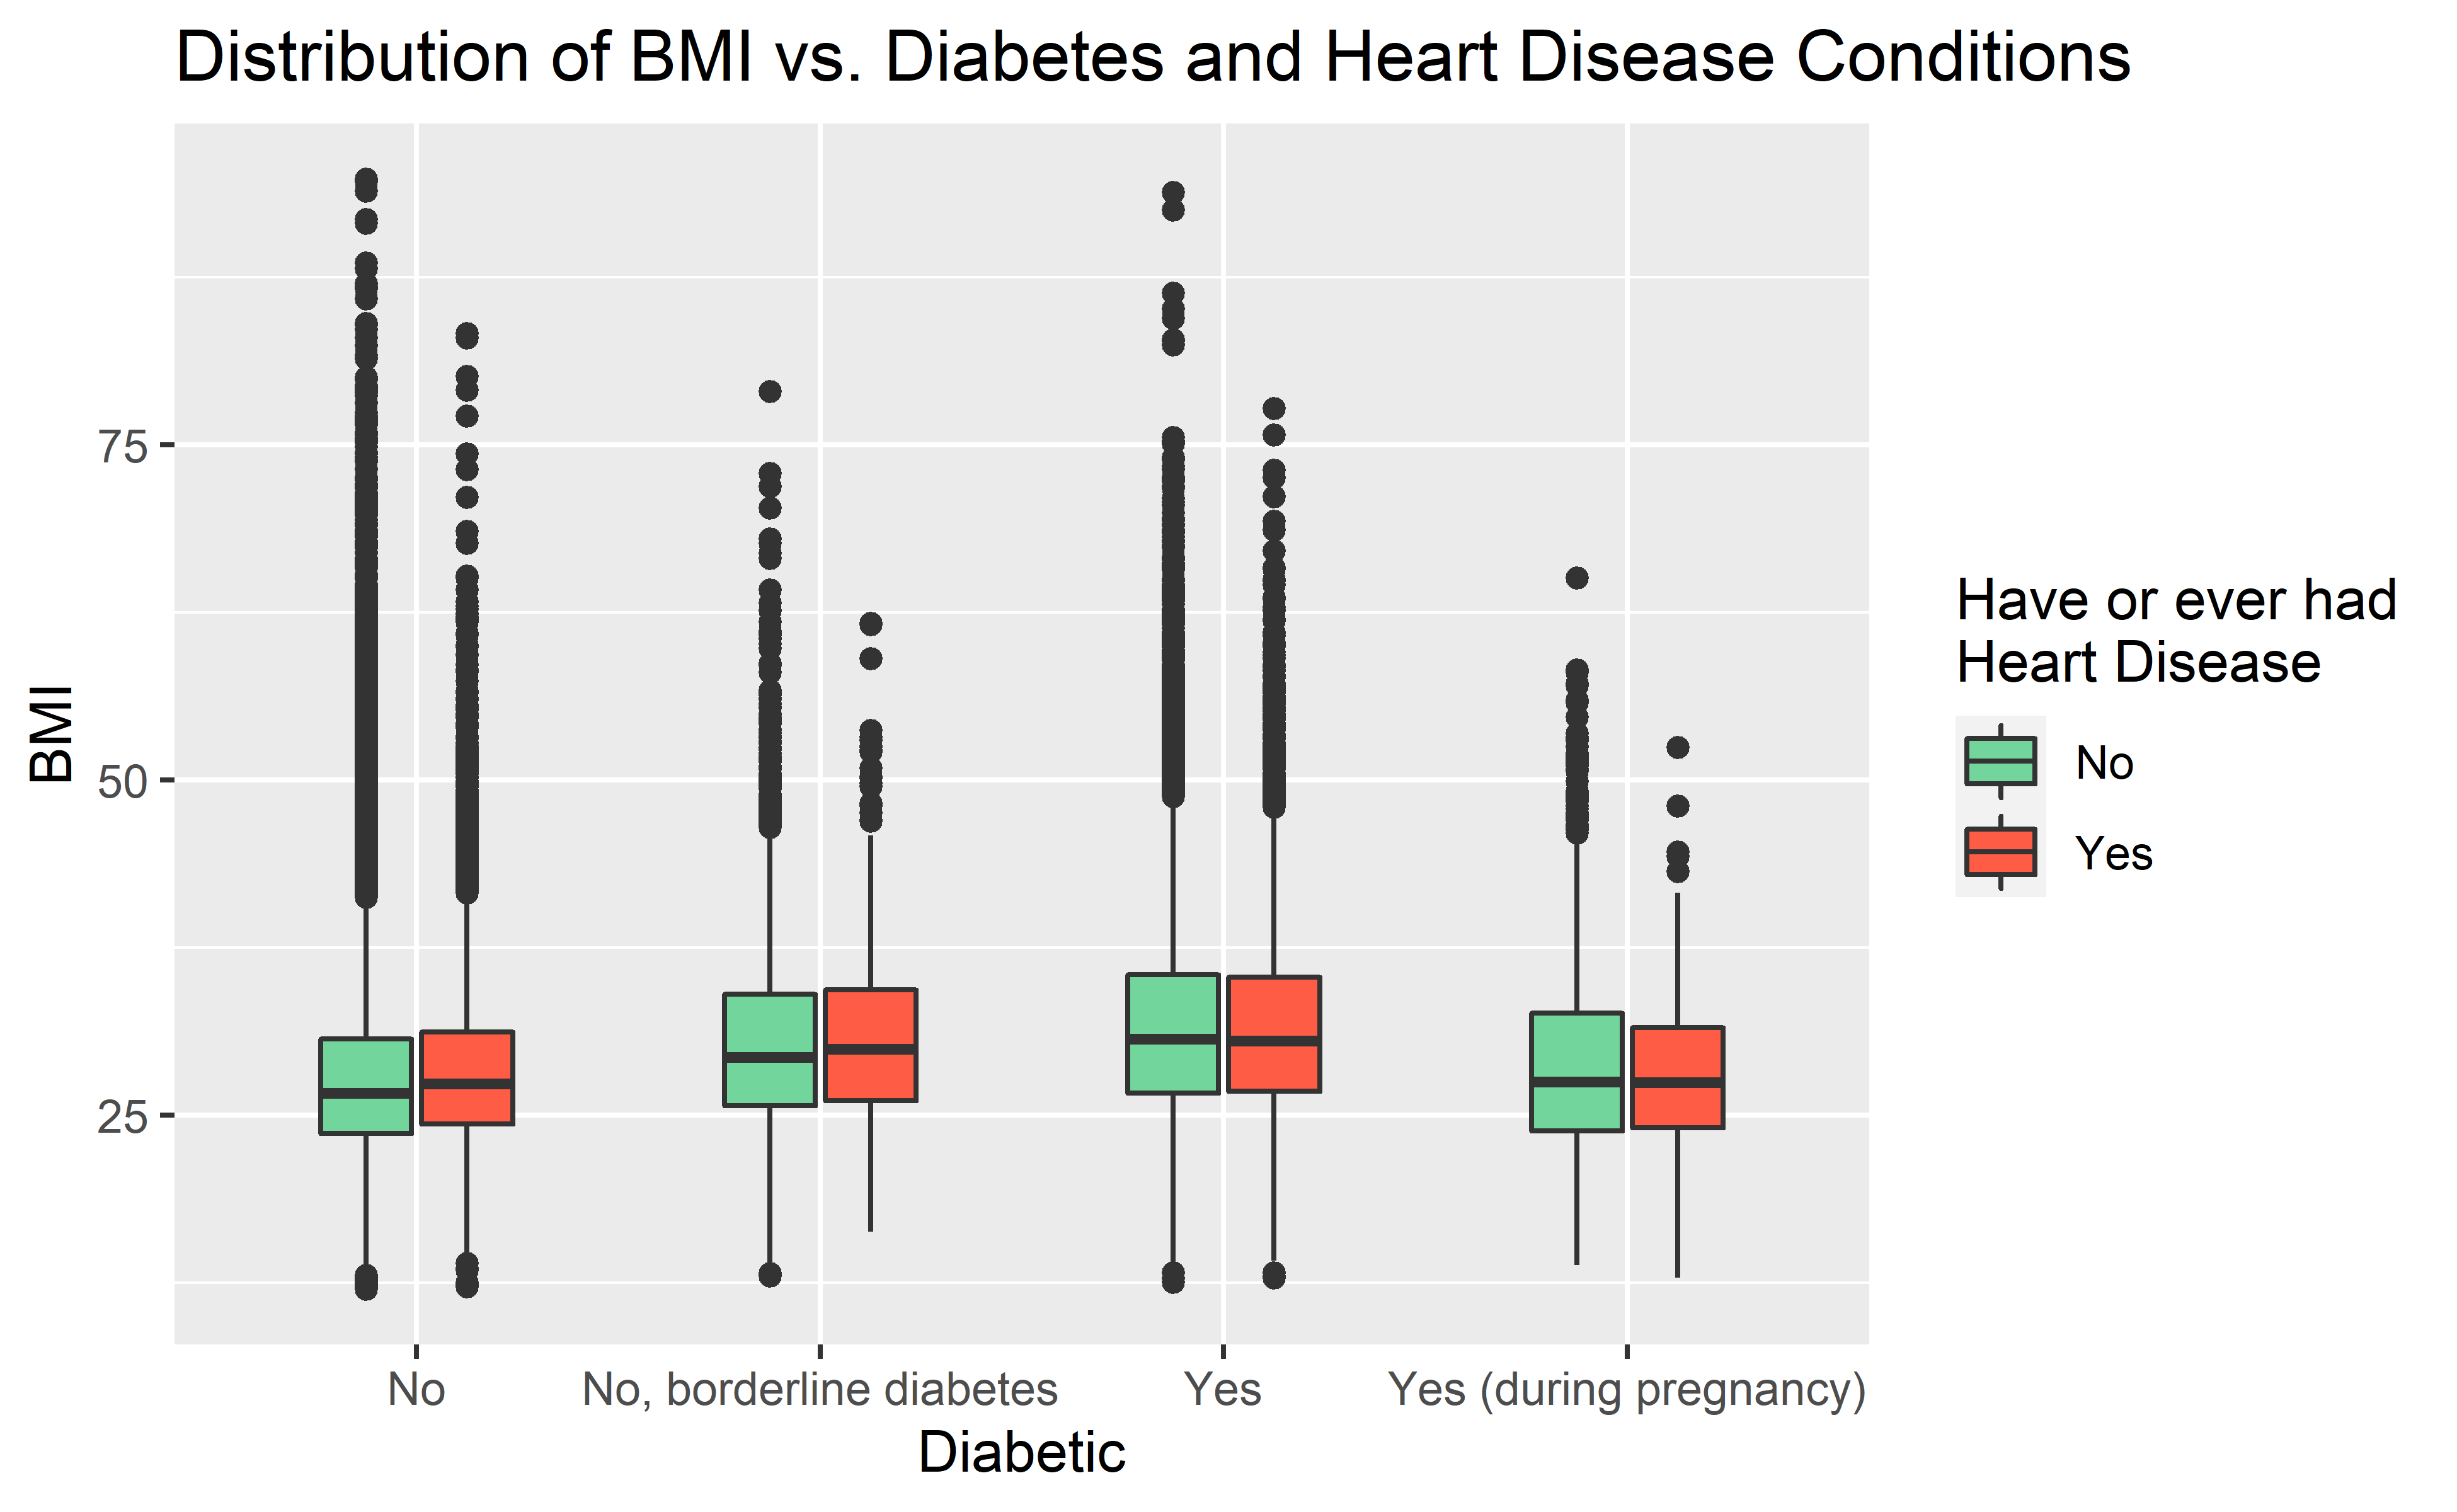
It is not obvious why diabetes is correlated to heart failure. However, we know that type 2 diabetes is usually related to obesity (high BMI), which may be the actual cause of heart disease.
From the box plot above, we can see that the respondents with diabetes (except during pregnancy) have a higher median BMI, and heart disease further magnifies this difference. For people with no or borderline diabetes, their median BMI is higher than they have ever had heart disease.
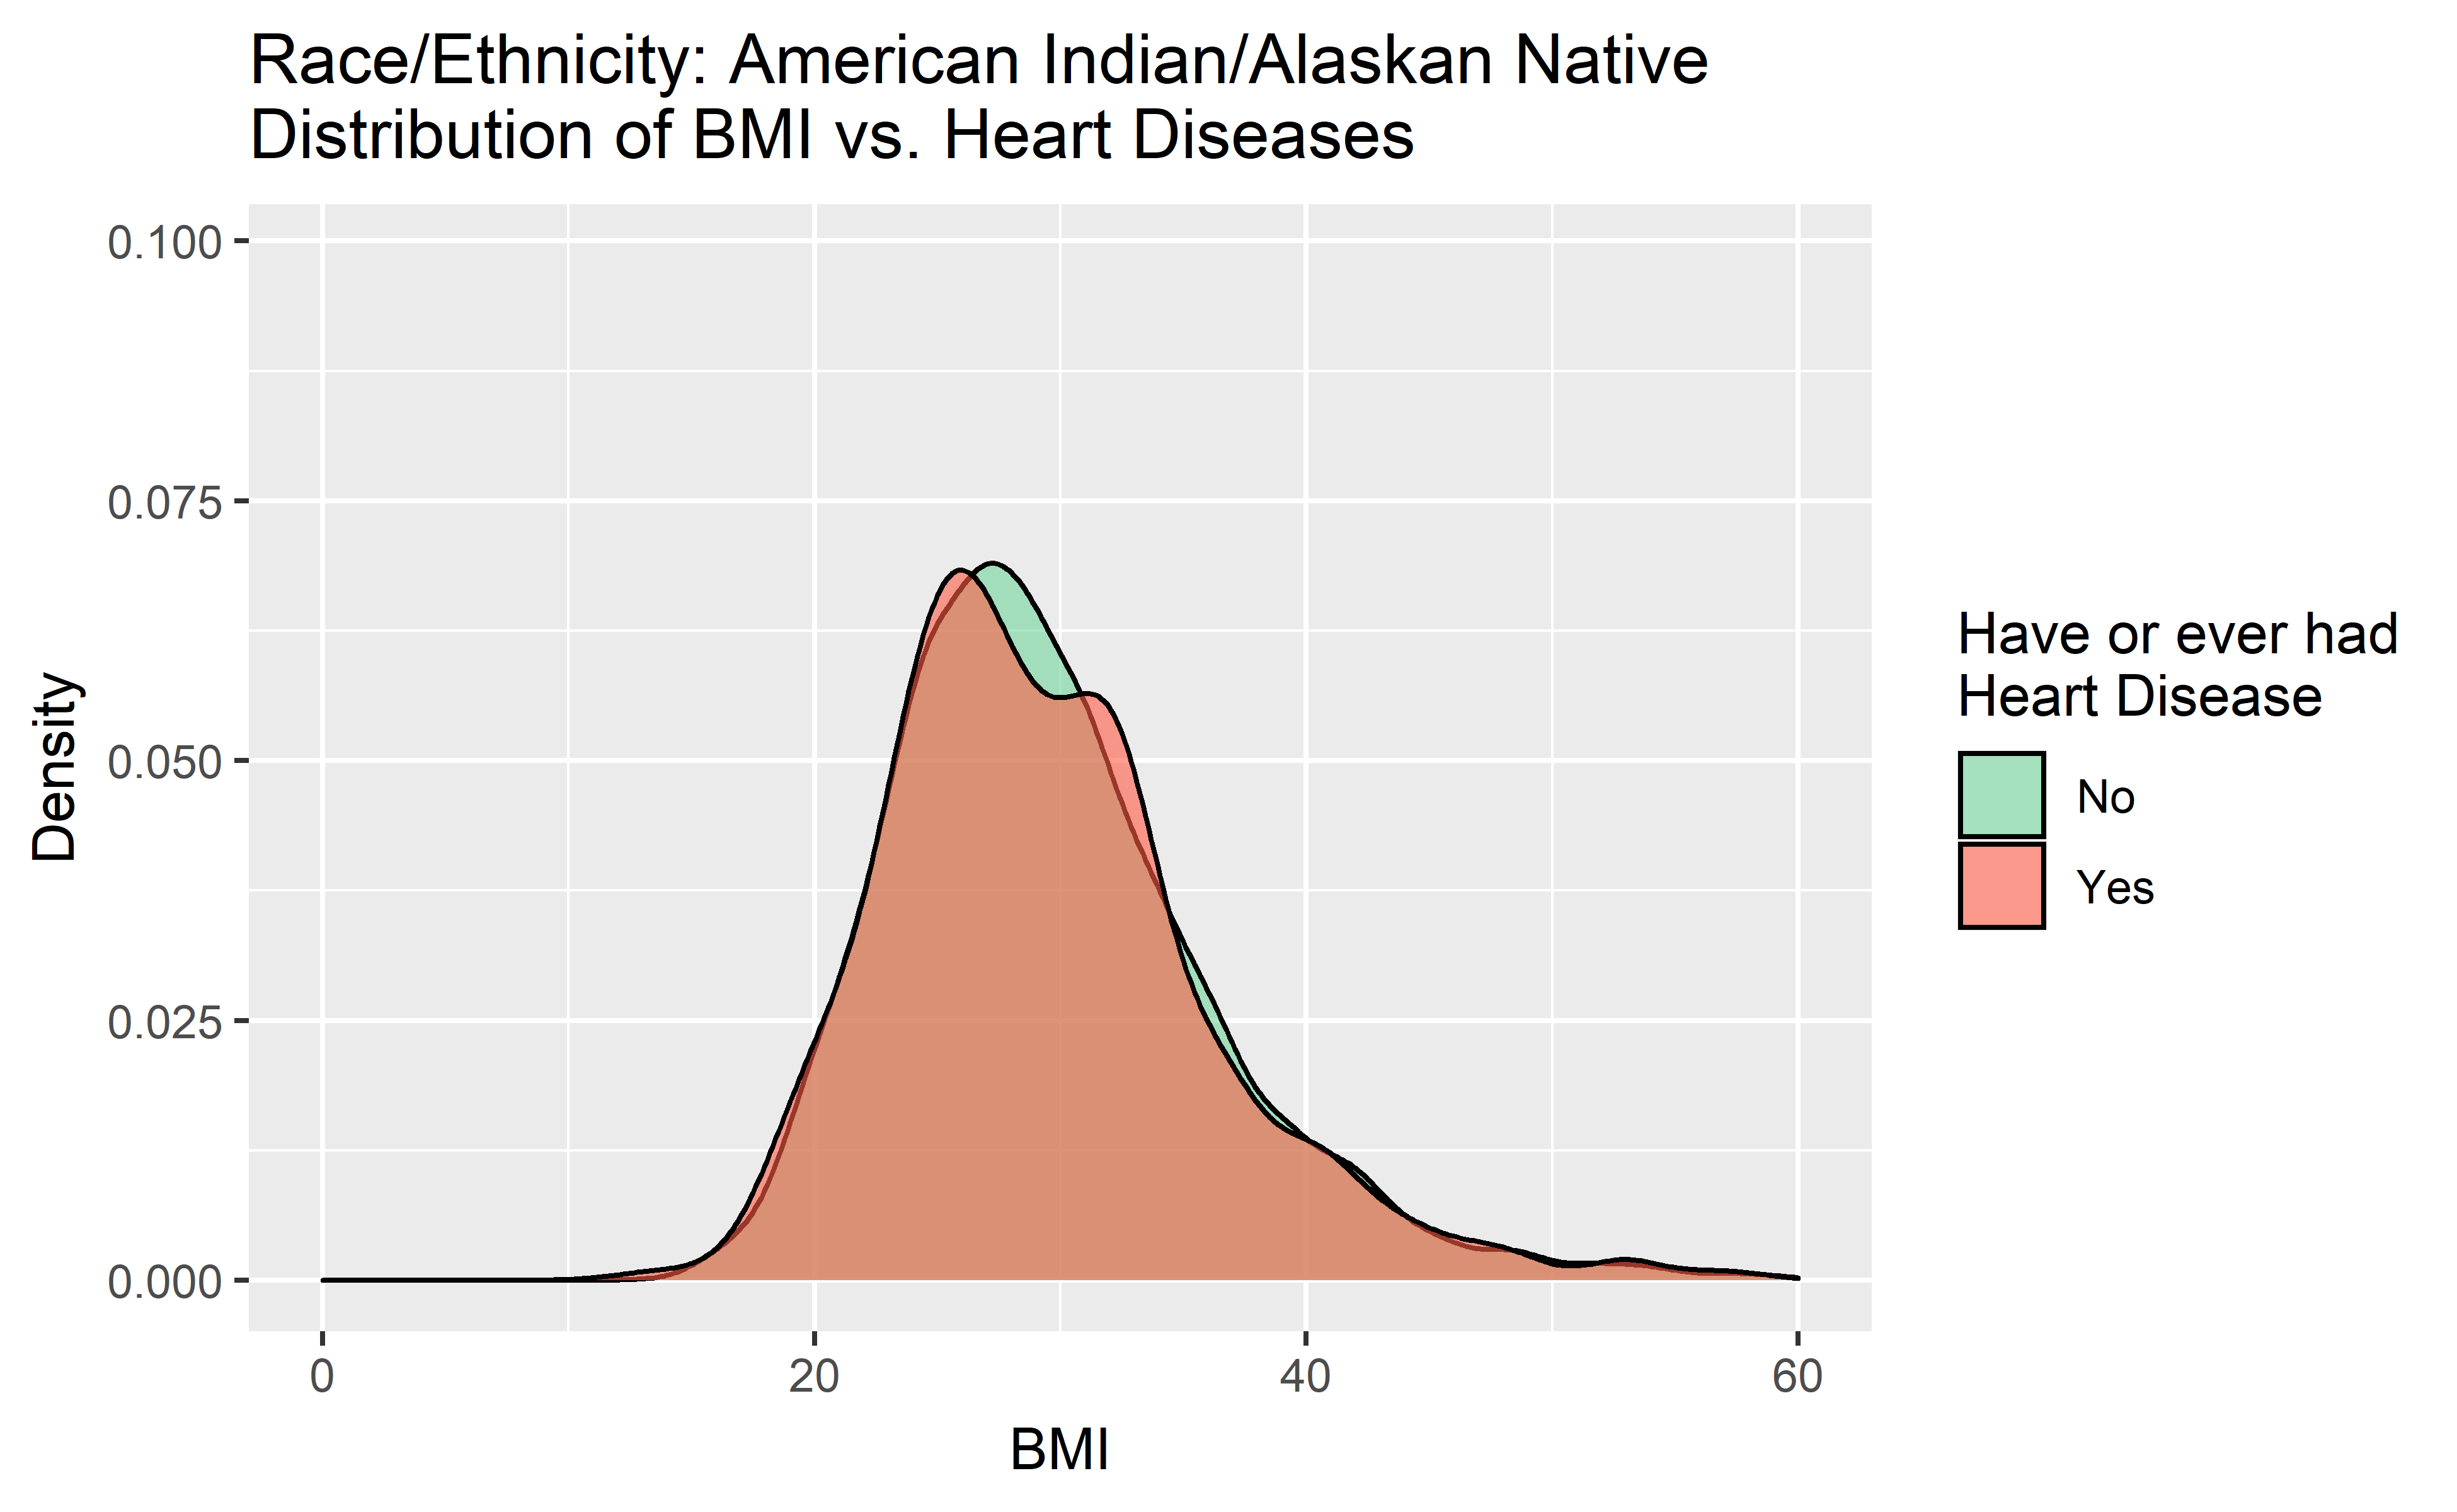
See the animation plot above. For almost all racial groups, except the Native Americans, people who ever have heart disease also have a higher BMI (obesity).
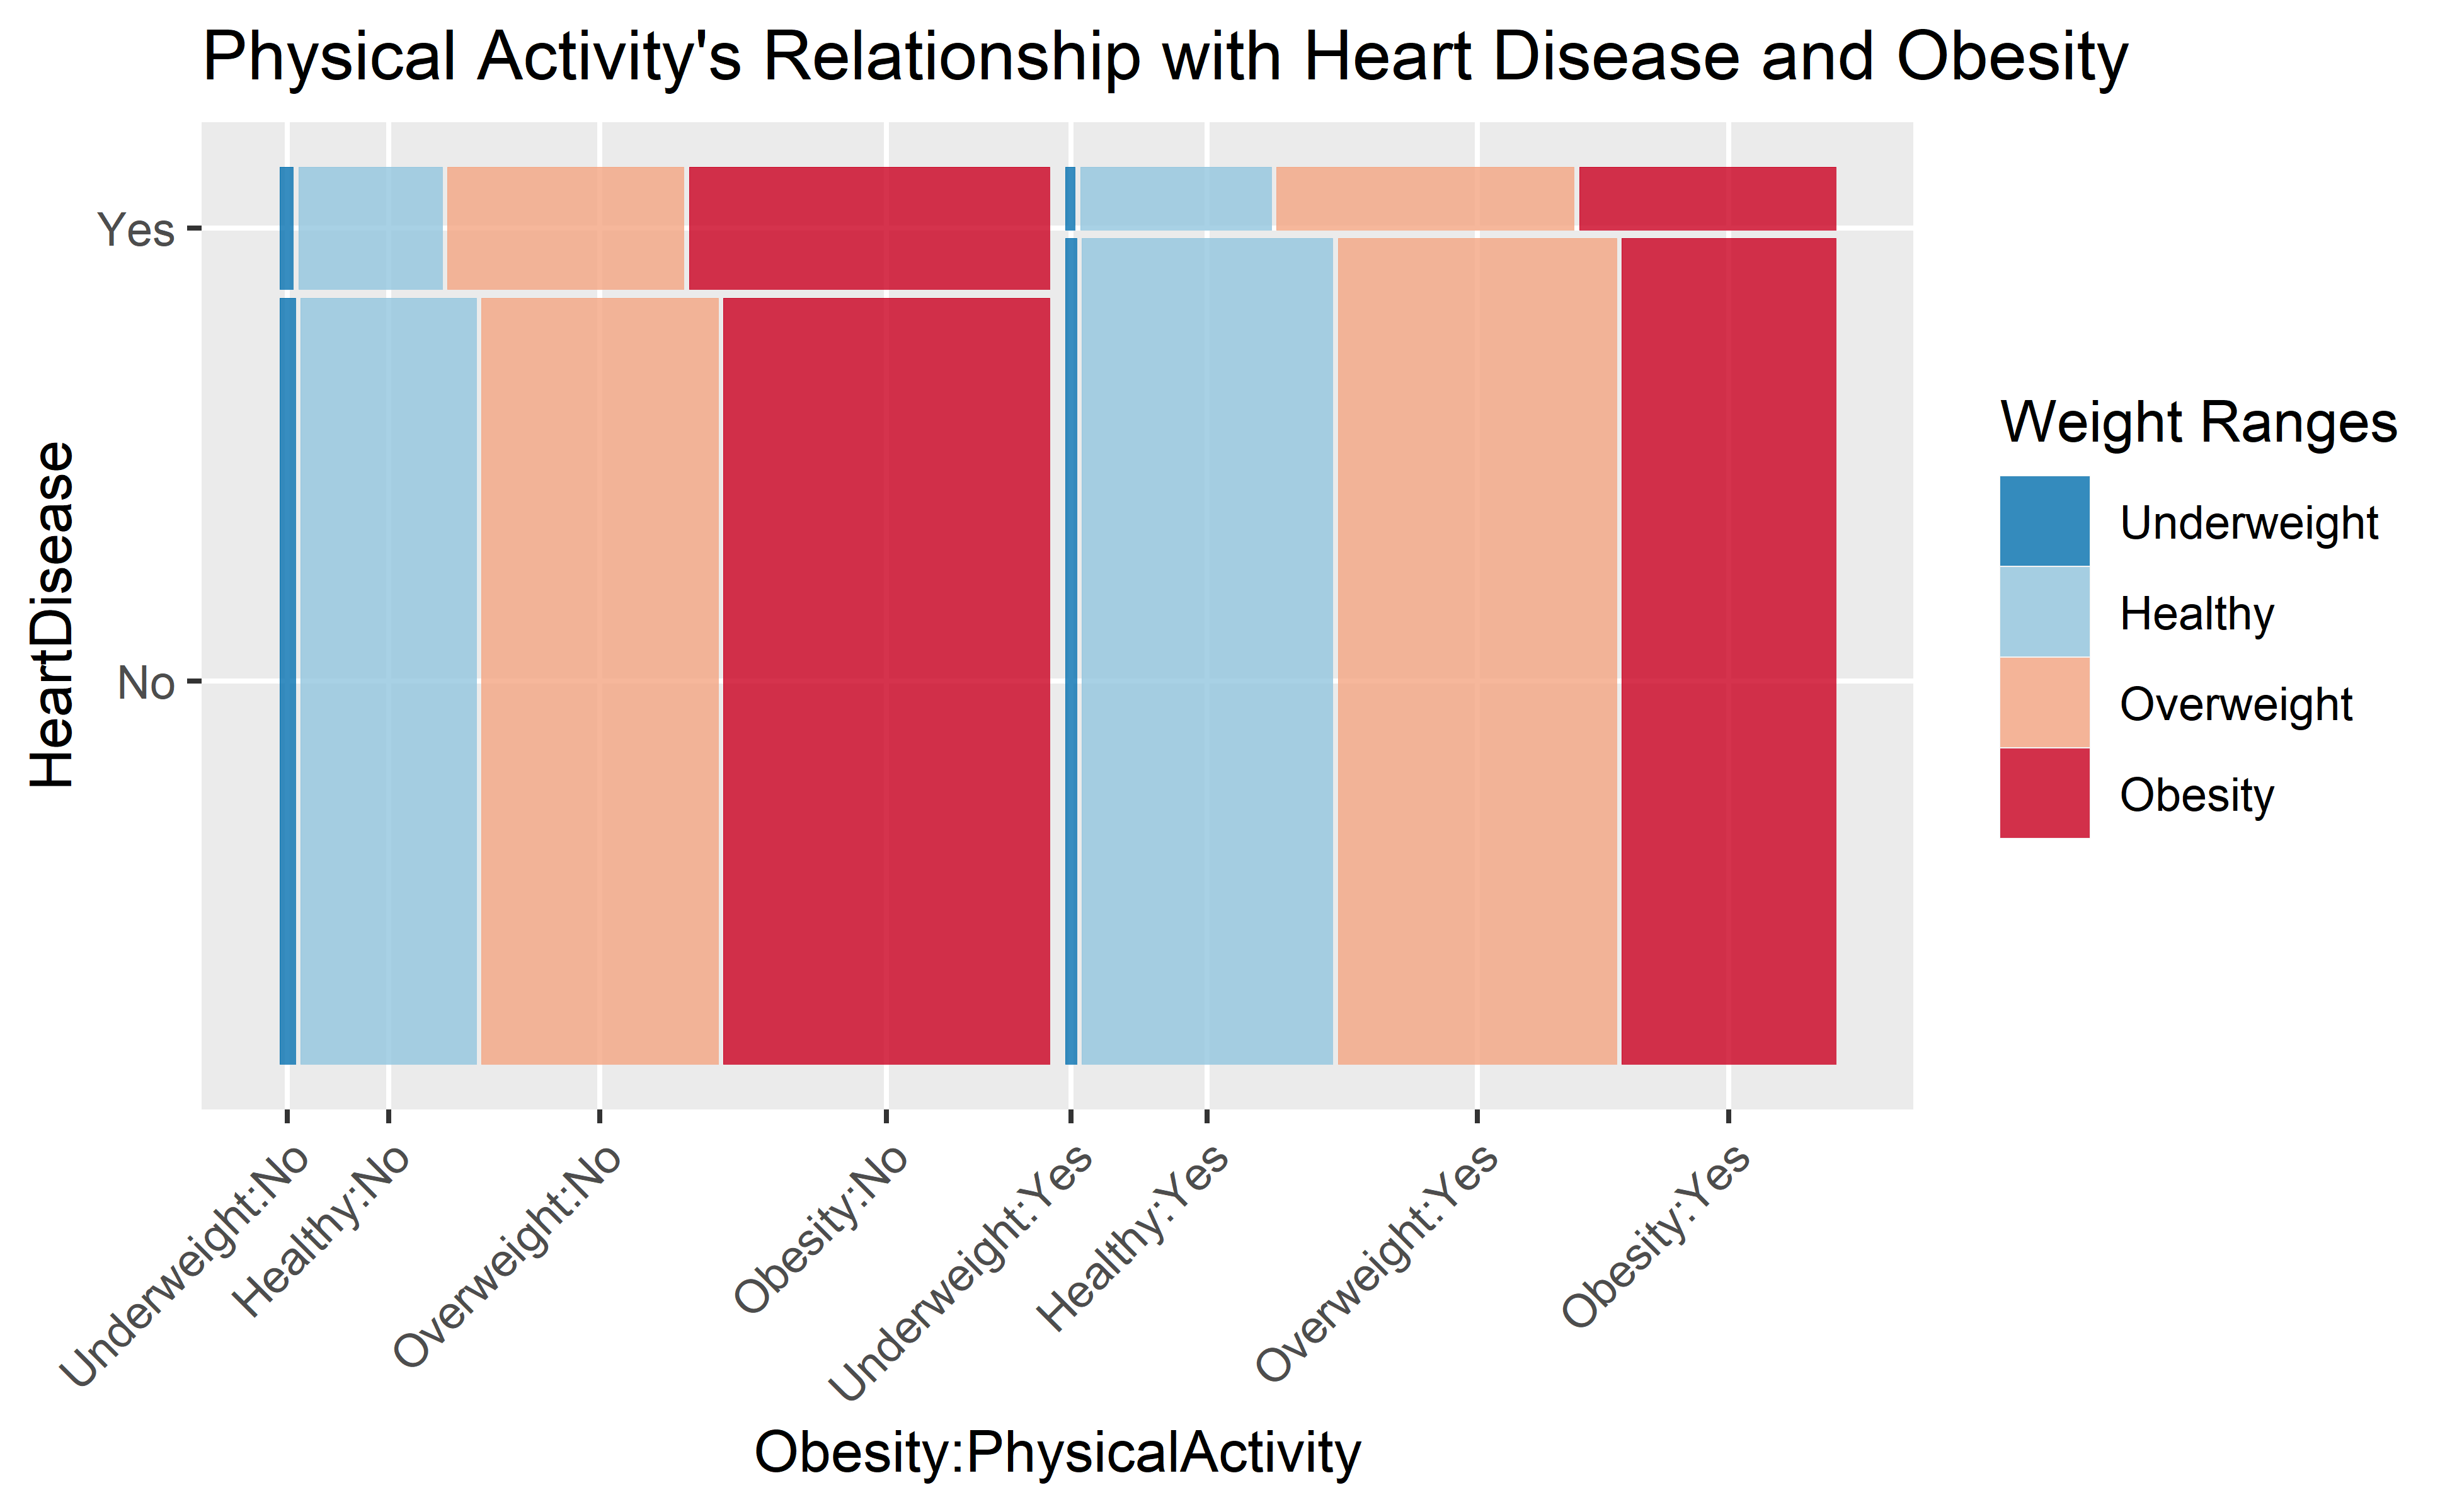
The increasing fat in the human body can enlarge the ventricle and atrium chambers, severely damaging cardiac functions. Thus, a positive correlation between BMI and heart disease is expected. In the mosaic plot above, we introduce an additional variable, Physical Activity Engagement, and we discretize the BMI into four levels: underweight (BMI < 18), healthy (18 <= BMI < 25), overweight (25 <= BMI < 30), and obesity (30 <= BMI).
As the plot shows, not only do people with heart disease have a higher obesity rate but they also engage less in the physical activity.
7. An Overview of Heart Disease Risk Factors
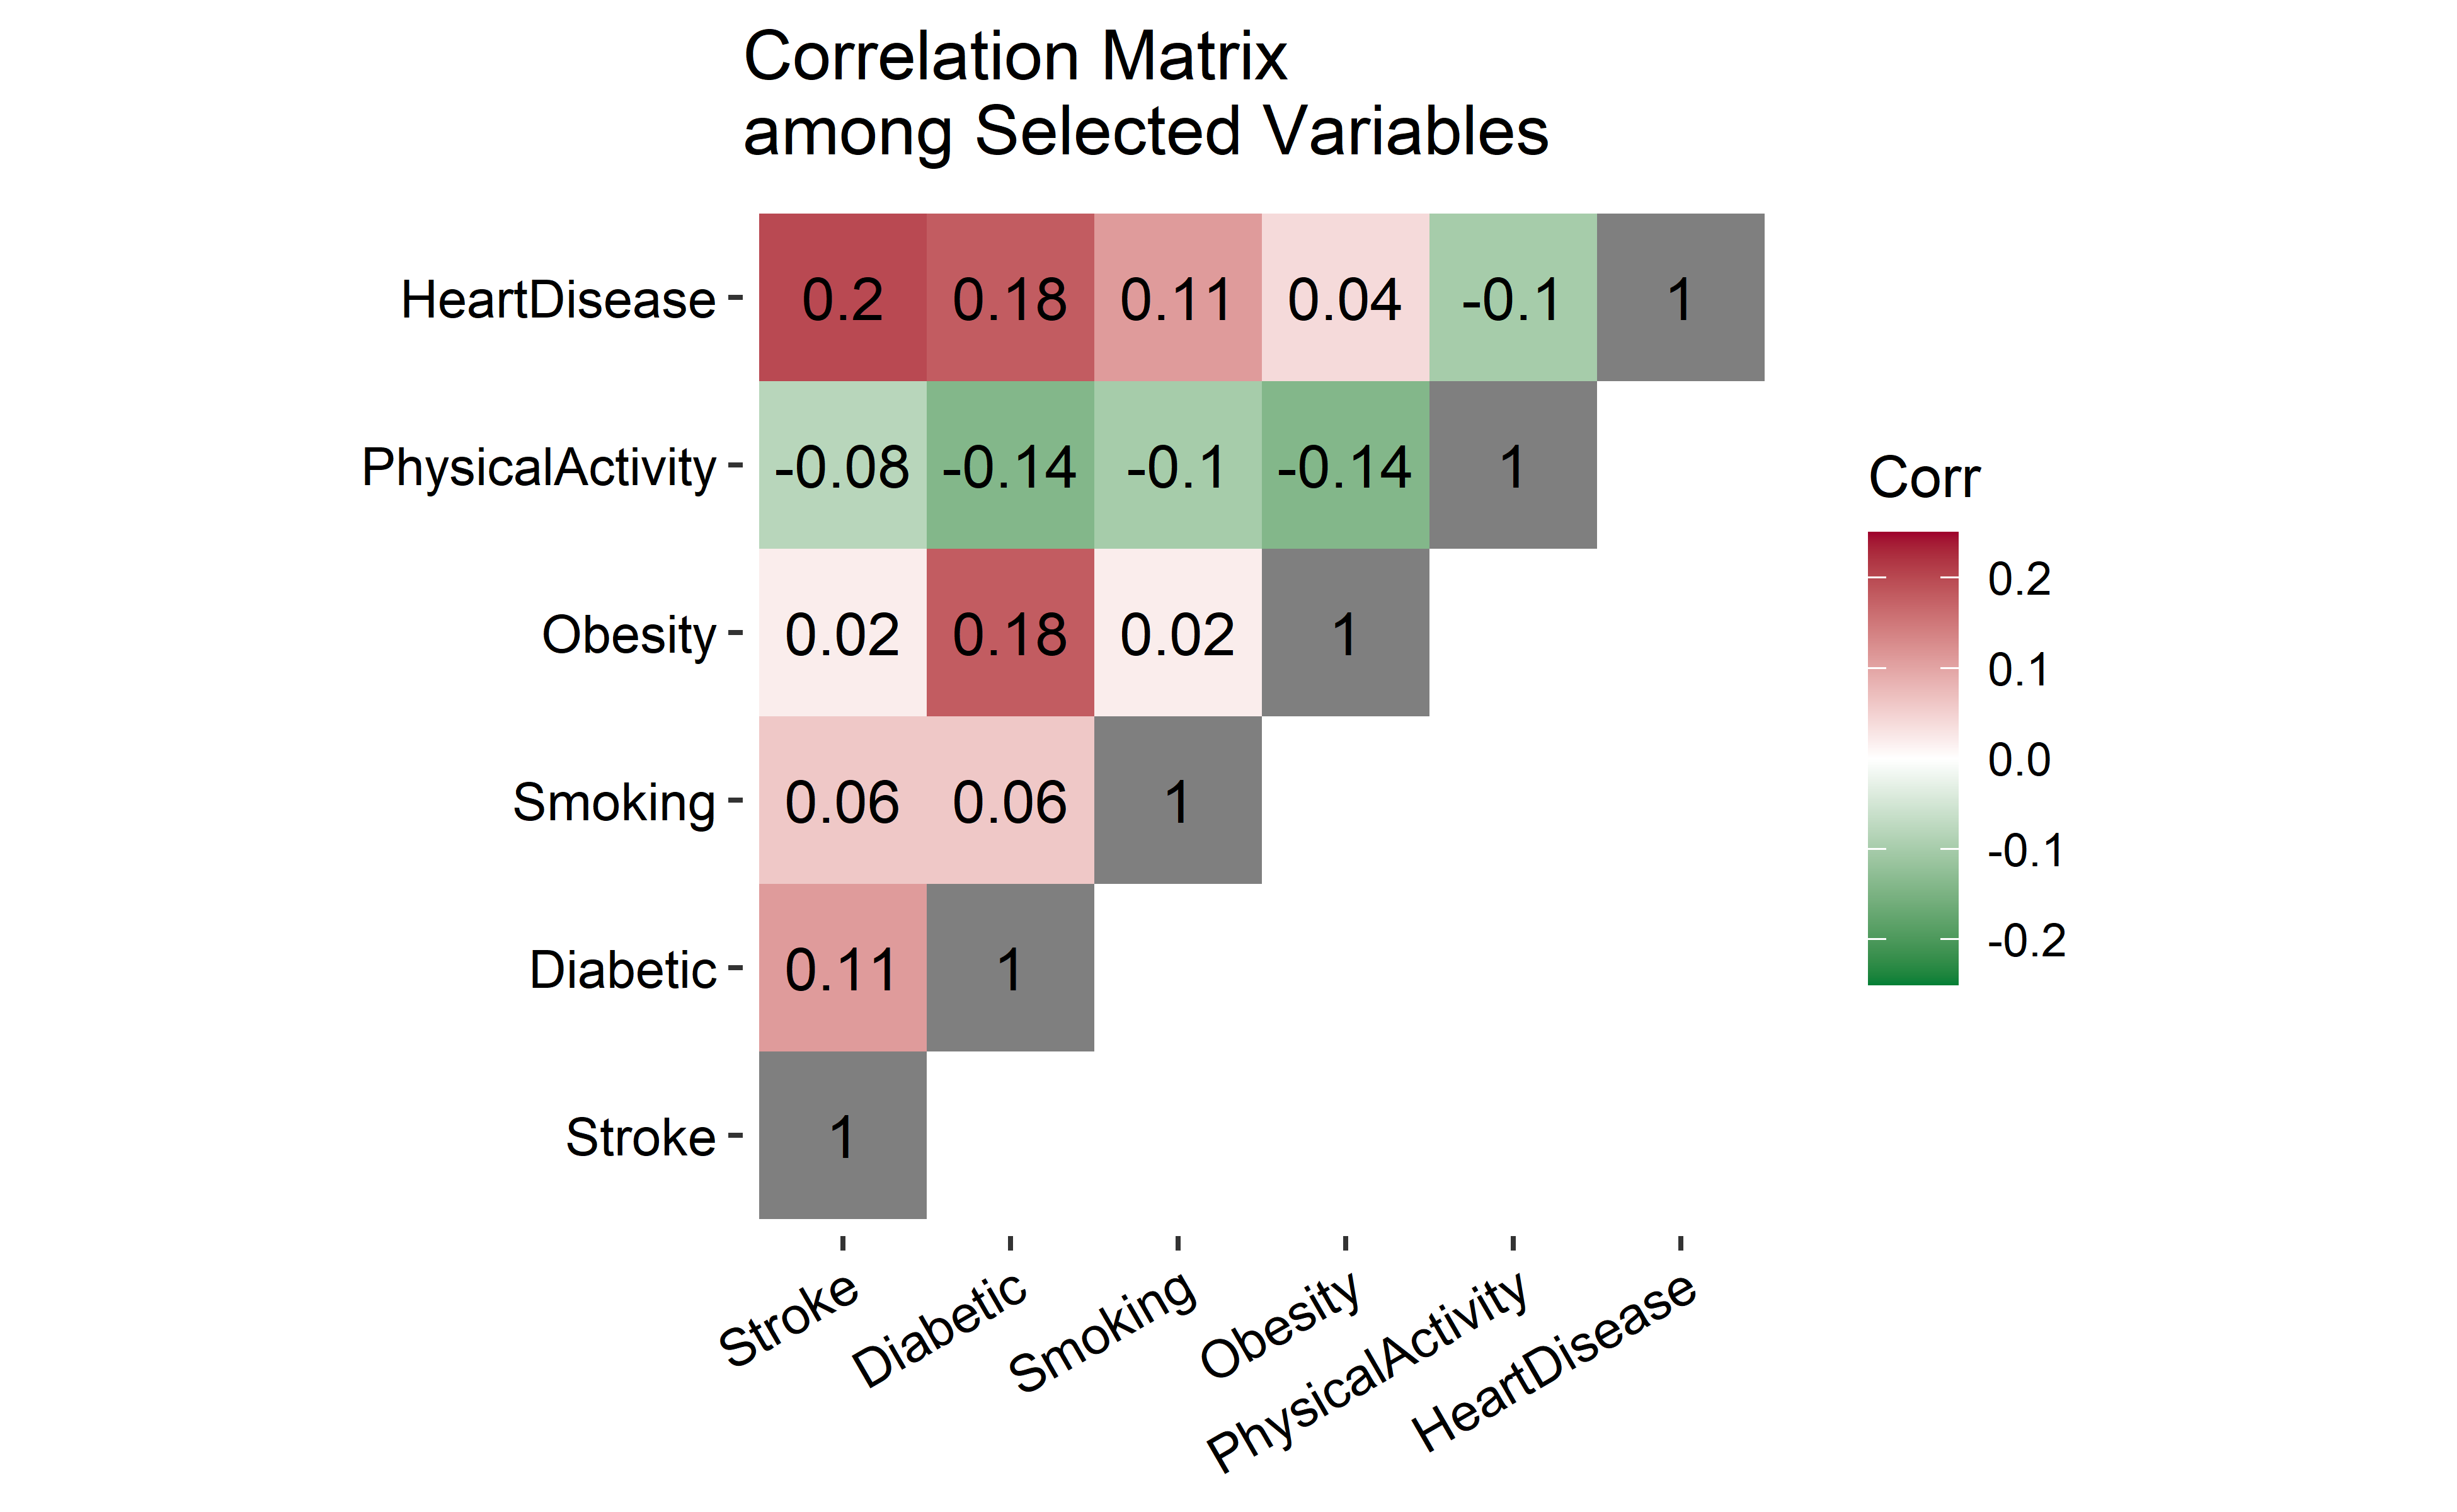
To summarize our findings, I compute the Chi-square correlations between the risk factors that we identify in the previous sections. The Chi-square correlation ranges from -1 to 1, the most negative to the most positive correlation.
As the correlation matrix shows, stroke, the vascular disease, has the strongest correlation with heart disease, and engagement with physical activity has the most negative correlation with developing heart disease. Obesity has a strong relationship with diabetes but is not an indicator of heart disease.
In short, exercising, not smoking, and having less sugar and fat in our meals seem to be the best way to protect us from developing heart disease.